 Embryo series courtesy of Einhard Schierenberg
Table of Contents
Abstract
Mass spectrometry (MS)-based shotgun proteomics is an enabling technology for the study of C. elegans proteins. When coupled with co-immunoprecipitation (CoIP), new interactions and functions among proteins can be discovered. We provide a general background on protein complexes and methods for their analysis, along with the lifecycle and interaction types of proteins that ultimately define the identifiable components of protein complexes. We highlight traditional biochemical methods to evaluate whether the complexes are sufficiently pure and abundant for analysis with shotgun proteomics. We present two CoIP-MS case studies of protein complexes from C. elegans, using both endogenous and fusion protein antibodies to illustrate the important aspects of their analyses. We discuss results from mass spectrometers with differences in mass accuracy and resolution, along with the relevant information that can be extracted from the data generated, such as protein relative abundance, post-translational modifications, and identification confidence. Finally, we illustrate how comparative analysis can reveal candidate binding partners for biological follow-up and validation. This chapter should act as a complement and extension to the WormBook chapter Biochemistry and molecular biology, which describes tandem affinity purification (TAP) of protein complexes for analysis by mass spectrometry.
C. elegans is an excellent model system for basic biology and increasingly for the study of disease phenotypes (WormBook chapter Obesity and the regulation of fat metabolism; Rodriguez et al., 2013). A remarkable amount of genetic reagents, resources, and information has been generated though these basic and translational studies. With the advent of numerous technologies, including mass spectrometry-based proteomics, studies of the protein-protein interactions within C. elegans are becoming commonplace (Tewari et al., 2004; Audhya and Desai, 2008; Biochemistry and molecular biology). These studies are beneficial since they can leverage the wide array of existing information and resources of the C. elegans community to quickly follow-up and understand protein-based discoveries.
There are some obvious advantages and challenges associated with using C. elegans as a biochemical tool, particularly for CoIP-MS of protein complexes, compared to more commonly used cell culture systems. First and foremost, novel protein-based findings can be quickly validated or rejected in a phenotypically-testable system (WormBook chapter Reverse genetics; Dong et al., 2007; Moresco et al., 2010). Thus, the inferred functional relevance and cooperativity between a protein of interest (POI) and a candidate protein that is pulled down during a CoIP can be directly correlated. Second, tissue-specific protein expression can also be considered, facilitating and/or necessitating the differentiation of tissue-specific protein interactions from CoIP-MS results. That is, the analysis of different cell types from worms, instead of a homogenous cell culture type, can provide information about the multiple functions and forms of a protein or protein complex. For instance, integration of a tagged fusion protein can be characterized to ensure appropriate cellular and subcellular localization. Additionally, if the fusion protein is integrated into a null mutant, the rescue of associated phenotypes can be tested to ensure proper protein function. Once integrated and characterized, a tissue-specific expressed and tagged POI can be used to pull down tissue-specific binding partners. Identified candidate tissue-specific POI binding partners can be validated through cytological co-localization experiments. The cuticle helps to make C. elegans a robust and easily-handled organism (WormBook chapter The cuticle), yet provides a tough exterior for protein complex-friendly lysis and separation of tissue types. Abundant proteins from large tissues are ideal CoIP-MS targets, but can obscure the POI if it is only expressed in a small number of cells. Sample complexity can be reduced with synchronization of worms or purification of specific cell types, such as embryos, and can alleviate some of these challenges. For worm CoIP methods, we point the reader to a number of excellent protocols on this topic (Biochemistry and molecular biology; Polanowska et al., 2004; Jedamzik and Eckmann, 2009), particularly to Zanin et al. (2011), which provides MS-compatible elution conditions. Throughout this chapter we will describe the methods that can be used to identify post-translational modifications, protein interactions, and complexes, enabling the researcher to exploit the advantages of C. elegans as a model organism to study basic biology and disease mechanisms.
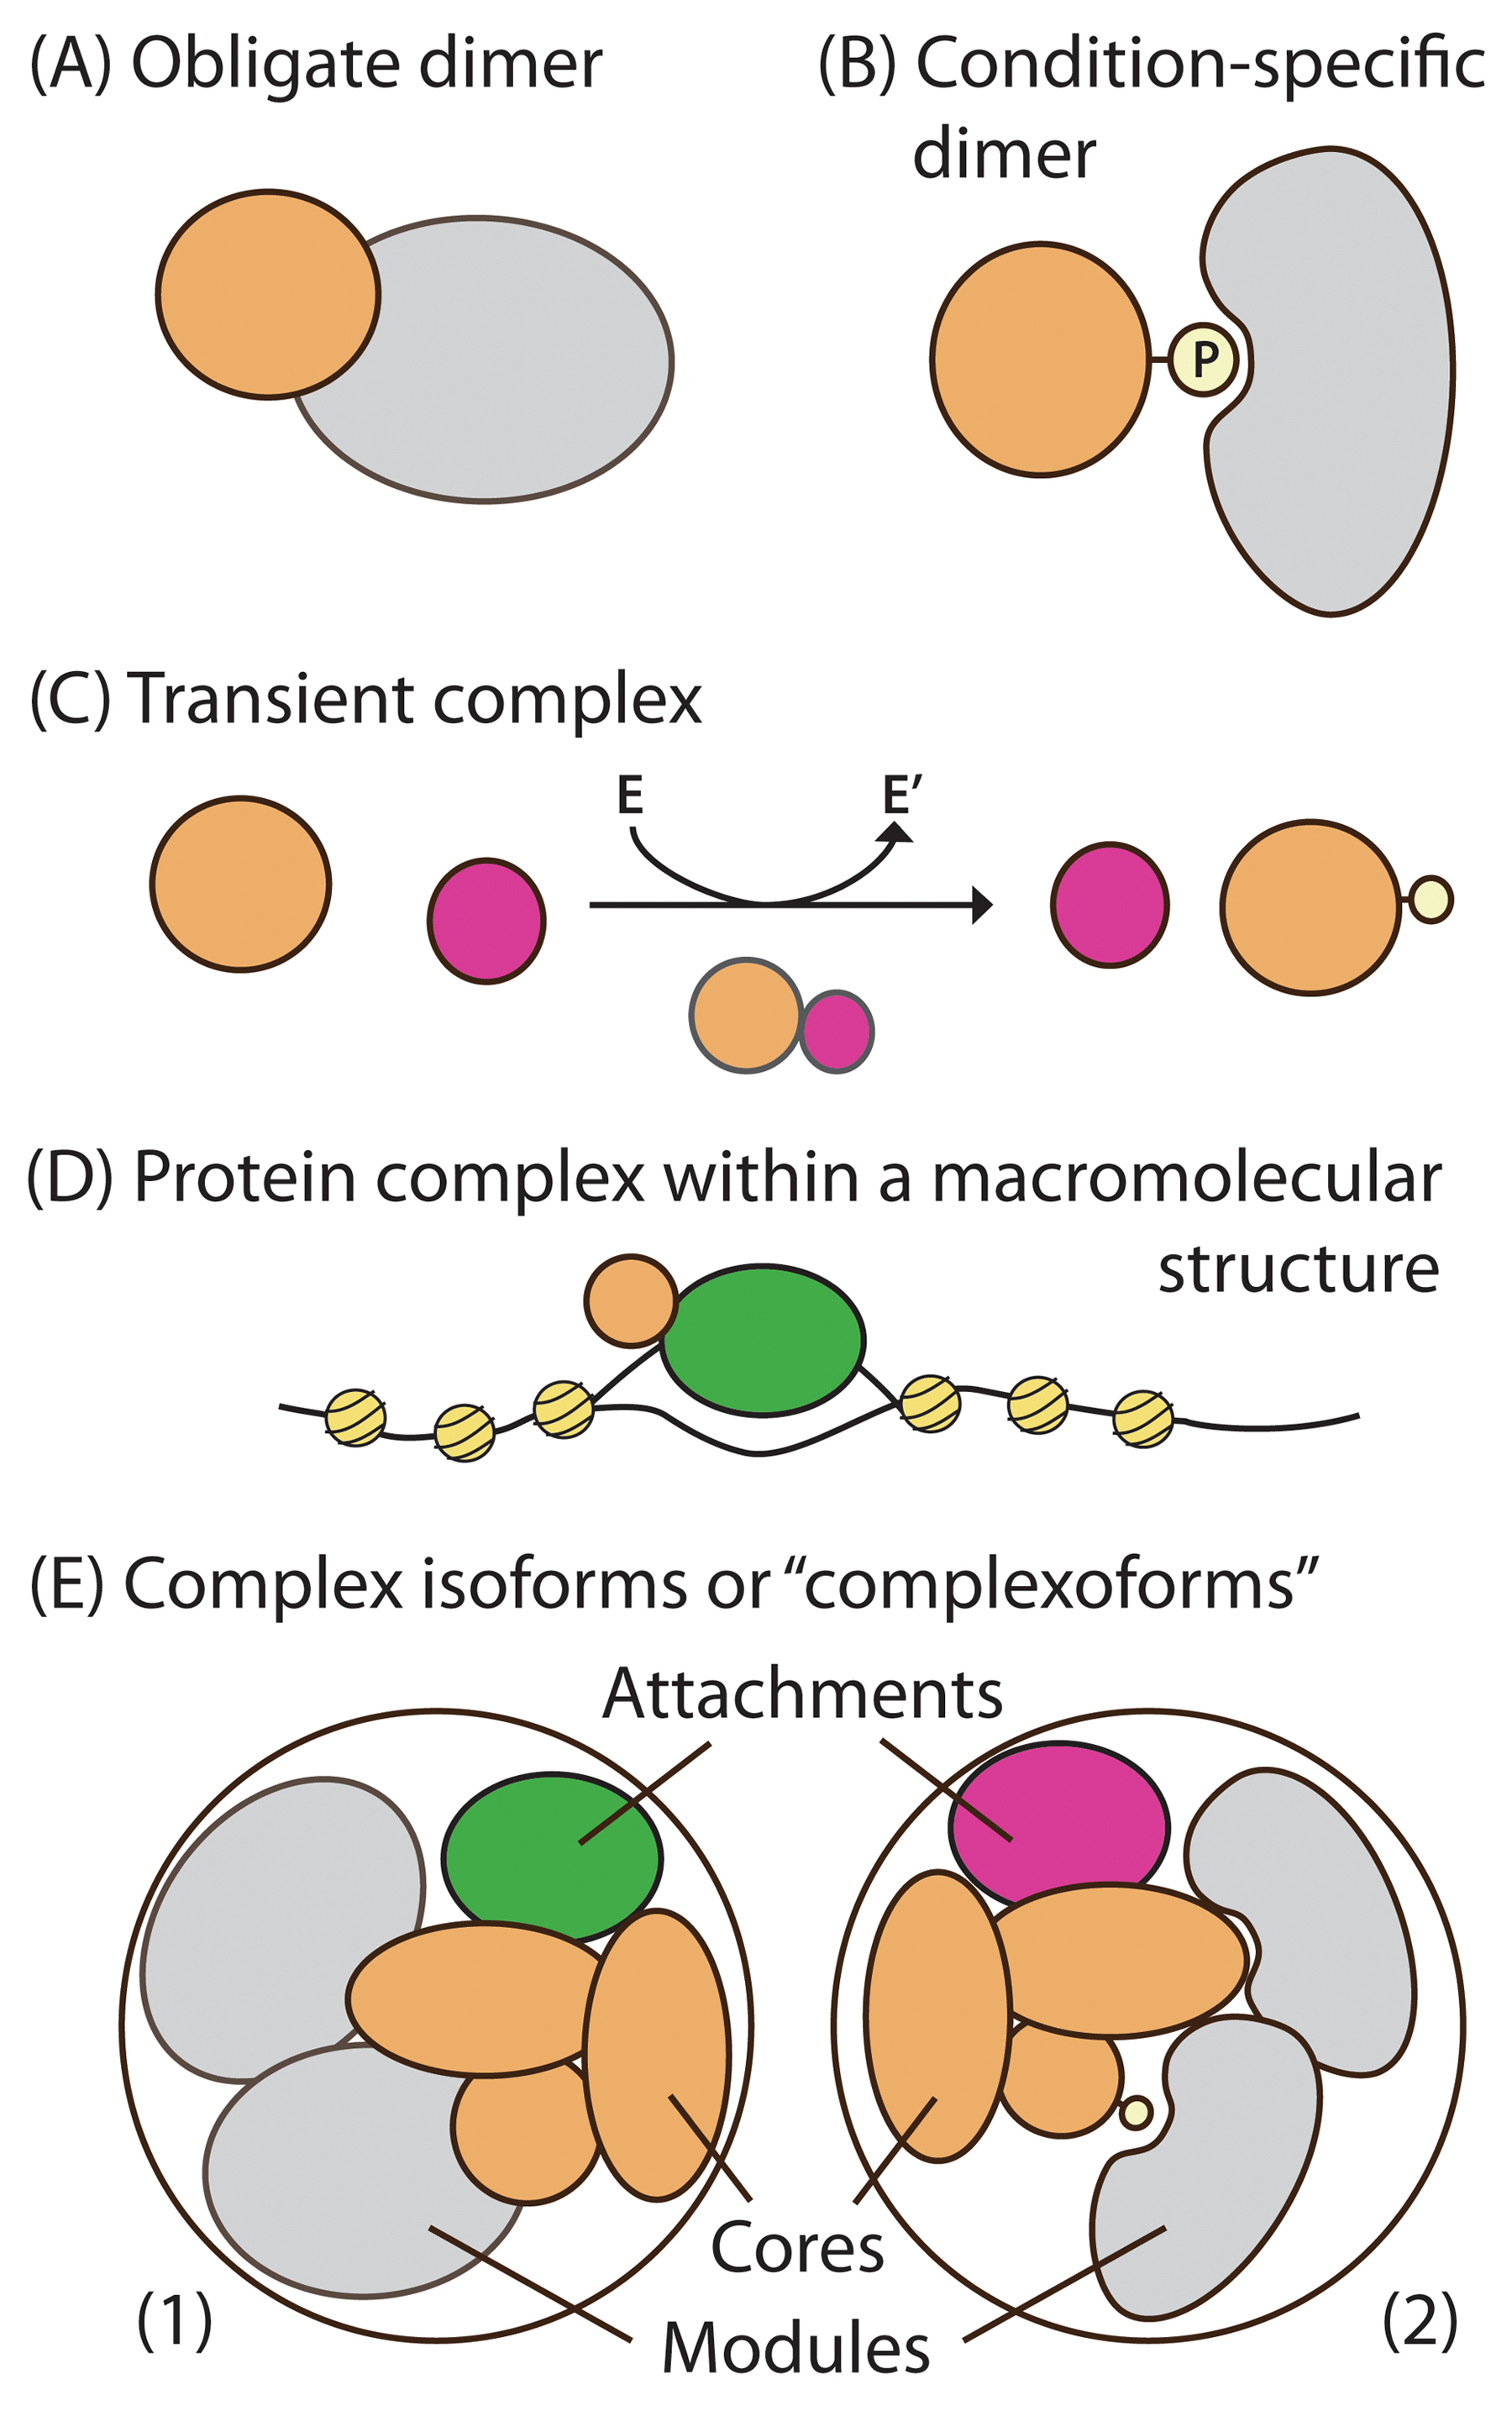
Proteins can be present in different types of complexes (Figure 1). The simplest is an obligate dimer where two proteins are always found together. Condition-specific complexes may only form in the presence of a post-translational modification, such as phosphorylation. Transient complexes, perhaps involving enzymes, may only interact briefly. The different time scales and stabilities of complex interactions can be defined by varying affinities of protein-protein interactions. Protein complexes that are part of larger macromolecular structures can co-purify other proteins and need to be isolated from the larger structure. Smaller, stable protein complexes can assemble as subunits to form larger “complex isoforms” or “complexoforms”. These complexoforms can also contain protein isoforms or PTMs (Talavera et al., 2013), recently deemed “proteoforms” (Smith et al., 2013). Because of the complex combinatorial nature of proteoforms and complexoforms, is it important for the researcher to determine which proteoforms of their POI may be tagged and/or pulled down from a CoIP.
|
Figure 1: Types of protein interactions and complexes: (A) obligate interactions, (B) condition-specific interactions, (C) transient complex between an enzyme and substrate representing transient interactions, (D) a DNA-bound protein representing protein complexes that are part of large macromolecular structures, and (E) “complex isoforms” or “complexoforms” containing cores, modules, and attachments (Adapted from Gavin et al., 2006) as combinations of obligate, condition-specific, and transient interactions.
While binary protein interactions can be determined with the yeast two-hybrid system (Boxem et al., 2008; Simonis et al., 2009) (Figure 1A), higher-order, in vivo protein-protein interactions are better elucidated using CoIP-MS. CoIP-MS experiments (Figure 2) generally involve the purification of a POI and its binding partners, followed by Multidimensional Protein Identification Technology (MudPIT) (Washburn et al., 2001), more generally known as shotgun or bottom-up proteomics (Zhang et al., 2013). Shotgun proteomics can identify hundreds of proteins from a CoIP within a few hours in an unbiased fashion. Putative interactions can be validated through reciprocal CoIPs with detection by shotgun proteomics or Western blotting. Global reciprocal CoIP-MS experiments performed in yeast (Gavin et al., 2002; Gavin et al., 2006; Krogan et al., 2006; Collins et al., 2007; Babu et al., 2012) have illustrated the concept of “complex isoforms” through the modularity of protein complex architecture. For instance, complexes averaged three to 12 protein components, depending on the study, ranging from two to 83 overall; some proteins were more promiscuous and were identified in many purifications and complexes. In general, these global CoIP-MS studies performed originally in yeast, and more recently with human cell lines (Ewing et al., 2007; Havugimana et al., 2012), have changed the way protein complexes are elucidated and understood. Thus, the researcher must be aware of these complexities and capabilities when designing an experiment and interpreting the results. Essentially, when a CoIP is performed on a single POI, all complexoforms which the POI participates in will be co-purified and co-identified. Complexoforms can be differentiated through multiple reciprocal purifications of different POI proteoforms and complex components (Gavin et al., 2006) and through intact complex analysis methods (Heck, 2008; Fonslow et al., 2010).
|
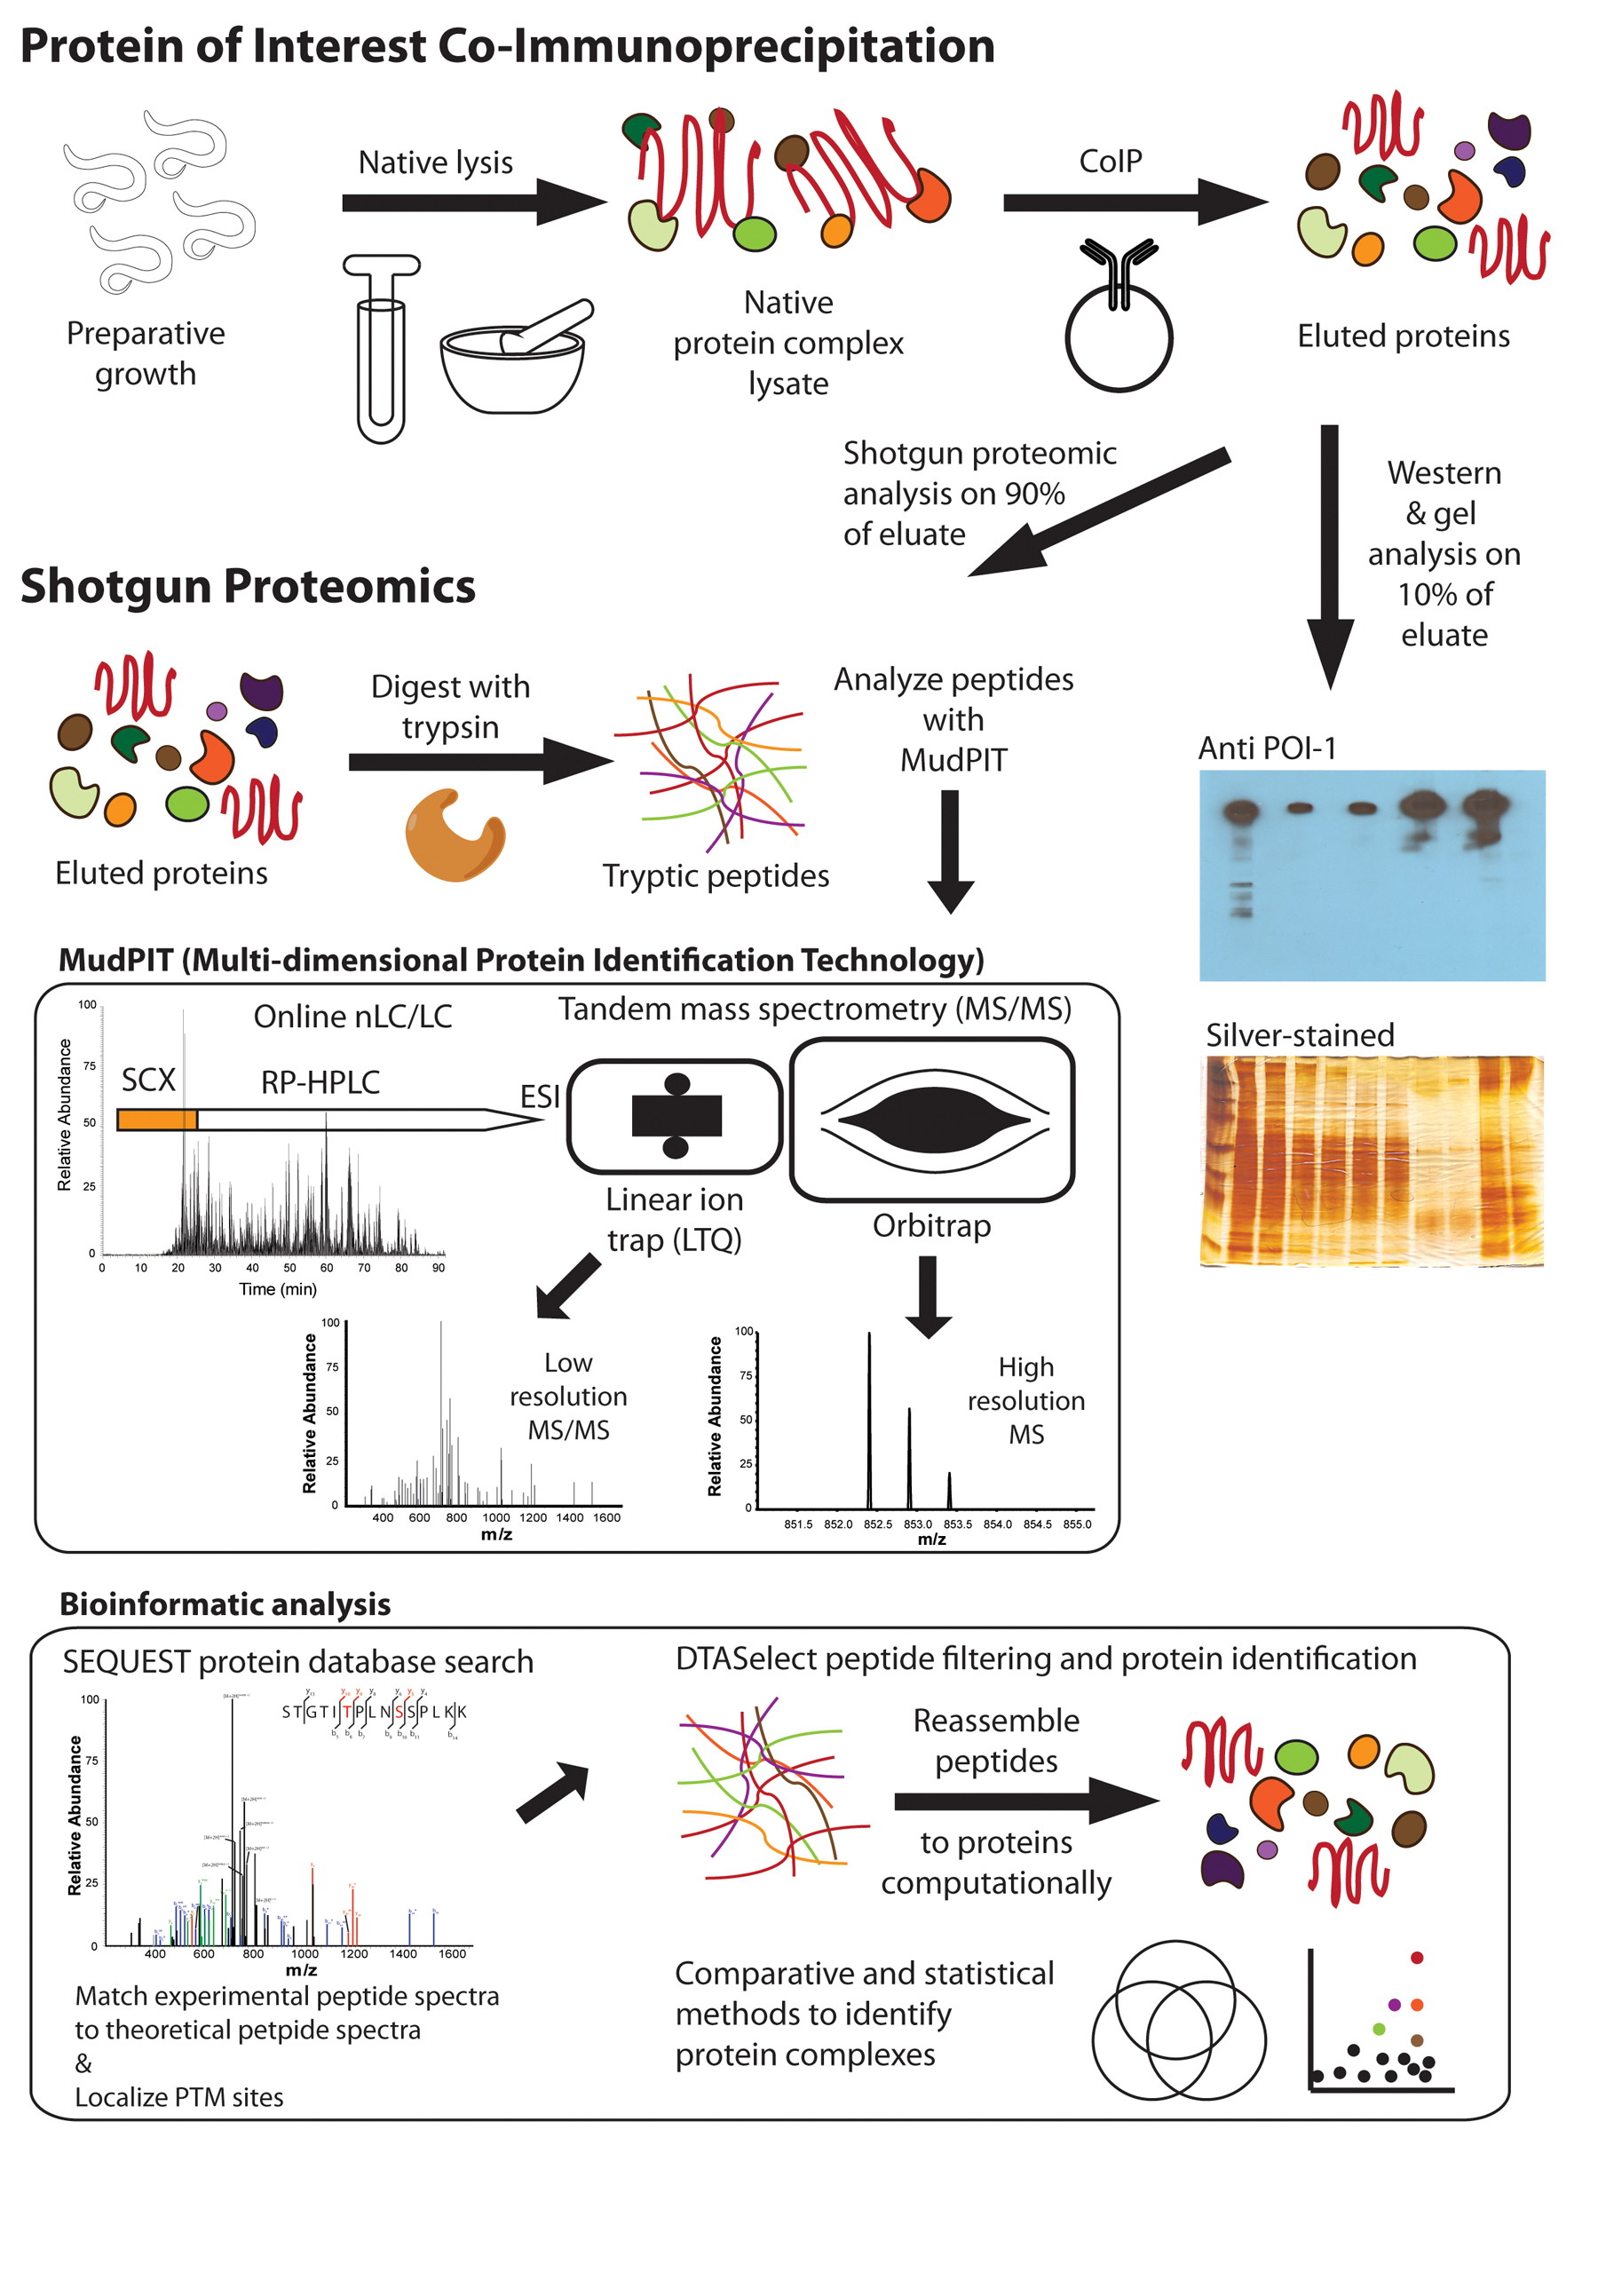
Figure 2: CoIP-MS schematic for analysis of C. elegans protein complexes. A preparative growth of animals is lysed in a protein complex-compatible buffer with a dounce on ice, bead beater at 4°C, or in liquid nitrogen with a mortar and pestle. The POI is CoIPed and eluted for proteomic analysis. Quality control, gel-based analysis is performed on 10% of CoIP (Figure 4). Shotgun proteomic analysis is performed on the remaining 90% of the CoIP. Proteins are precipitated with tricholoracetic acid (TCA)/acetone or methanol/chloroform to remove lipids and surfactants. Proteins are resolubilized, primarily with 8 M urea, then alkylated, reduced, and digested to peptides with trypsin. Tryptic peptides are analyzed using MudPIT, consisting of online nLC/LC-MS/MS. Peptides are fractionated by charge with strong cation exchange (SCX) chromatography and then further separated by hydrophobicity with reverse-phase high performance liquid chromatography (RP-HPLC). Separated peptides are transferred into the mass spectrometer by electrospray ionization (ESI) where their intact and fragment ion masses can be measured with either high or low mass accuracy and resolution using the LTQ or the Orbitrap, respectively. Bioinformatic analysis is performed on the MS/MS data. A SEQUEST protein database search is used to match experimental and theoretical peptide spectra and to localize PTMs. Spectra can be manually annotated to validate peptide identification or PTM localization. In this case, the blue and green annotations are sequence informative ions while the red ions are phosphorylation site-specific ions that localize the PTMs. DTASelect is used to filter confident peptide matches and reassemble the peptides into proteins. Further analysis can be performed between replicate and comparative runs with Venn diagrams or more sophisticated statistical software (see Figure 5).
In addition to identification of POI binding partners, analysis of CoIPs by MS has other notable advantages. Numerous PTMs (Table 1) can also be readily identified during CoIP-MS experiments. PTMs can be identified on peptides by consecutive measurements of mass differences in both intact peptide and fragment ion masses. Condition-specific PTMs and interactions can be discovered through the purification of protein complexes from different genetic backgrounds and conditional treatments. Moreover, the identification of co-immunoprecipitated proteins with MS provides an unbiased, broad view of the interactions and functions of a POI, facilitating new and unexpected biological discoveries (Skop et al., 2004; Audhya et al., 2005; Cheeseman et al., 2005; Gottschalk et al., 2005; Duchaine et al., 2006; Olson et al., 2006; Audhya et al., 2007; Grill et al., 2007; Schlaitz et al., 2007; Zhang et al., 2007; Gassmann et al., 2008; Csankovszki et al., 2009; Dammermann et al., 2009; Gu et al., 2009; Welburn et al., 2010; Witte et al., 2011; He et al., 2012; Zhang et al., 2012). Notably, combining different purification methods with shotgun proteomics has also been successful for identifying protein interactions by pull-downs with small molecules (Min et al., 2007), chromatin (Chu et al., 2006), lipid rafts (Rao et al., 2011), and lipid droplets (Zhang et al., 2012). As methods have improved, mostly though advances in mass spectrometer speed and sensitivity, a greater number of putative protein interactions are found. Thus, these larger, more comprehensive data sets have become less straightforward to interpret manually. Bioinformatic methods have been introduced to provide confidence values to CoIPed proteins from these larger data sets (Krogan et al., 2006; Sowa et al., 2009; Choi et al., 2011; Jager et al., 2012). These analyses often allow for differentiation of protein complex components from background proteins. We will illustrate how one such program, the Comparative Proteomic Analysis Software Suite (CompPASS) (Sowa et al., 2009), can be used on nematode CoIP-MS data to find validated protein interactions and new candidate binding partners. Collectively, the combination of cross-disciplinary methodologies can elucidate different types of biologically-relevant protein complex interactions from C. elegans.
Table 1: List of common MS-identifiable PTMs.
| PTM | Mass shift (Δ Da) | Considerations |
|---|---|---|
| Phosphorylation | + 79.9663 | Use phosphatase inhibitors |
| Acetylation | + 42.0106 | Has a similar mass shift associated with lysine carbamylation from urea and trimethylation |
| Ubiquitination | + 114.0429 |
Trypsin digestion leaves C-terminal GG on lysine Chloroacetamide should be used for protein alkylation |
| Methylation | + 14.1097 | Avoid methanol in sample preparations |
The remaining sections will refer to actual CoIP-MS data we have generated and analyzed as case studies for this chapter. The first POI (POI#1) is ALP-1, an alpha-actinin-associated LIM-Enigma family protein that is required for maintenance of actin filament organization and for stabilizing muscle contraction. ALP-1 is a soluble, abundant protein, making CoIP-MS analysis relatively straightforward. ALP-1 falls into the category of macromolecular-bound since it associates with actin, so we will discuss the results in this context. We performed CoIPs from UU18, a strain with GFP fused to an ALP-1 exon that is expressed as three isoforms (proteoforms): ALP-1b, c, and d (McKeown et al., 2006). Therefore, we expect at least three complexoforms to exist. A GFP-expressing strain driven by the identical alp-1 promoter would have been ideal to serve as a negative control, but was not available. Instead we used a strain expressing GFP in the muscle as the bulk of ALP-1 expression is also in the muscle. We used anti-GFP antibody to perform the CoIPs in this example.
POI#2, a soluble protein of lower abundance than ALP-1, is from an on-going CoIP-MS study. We included this case study since the experimental design, quality control experiments, and results were ideal to illustrate the successful execution of a CoIP-MS study using an antibody to an endogenous protein. We expect many complexoforms to be isolated, as this polyclonal antibody should recognize all isoforms of POI#2. A null mutant strain of POI#2 was used for negative control CoIPs.
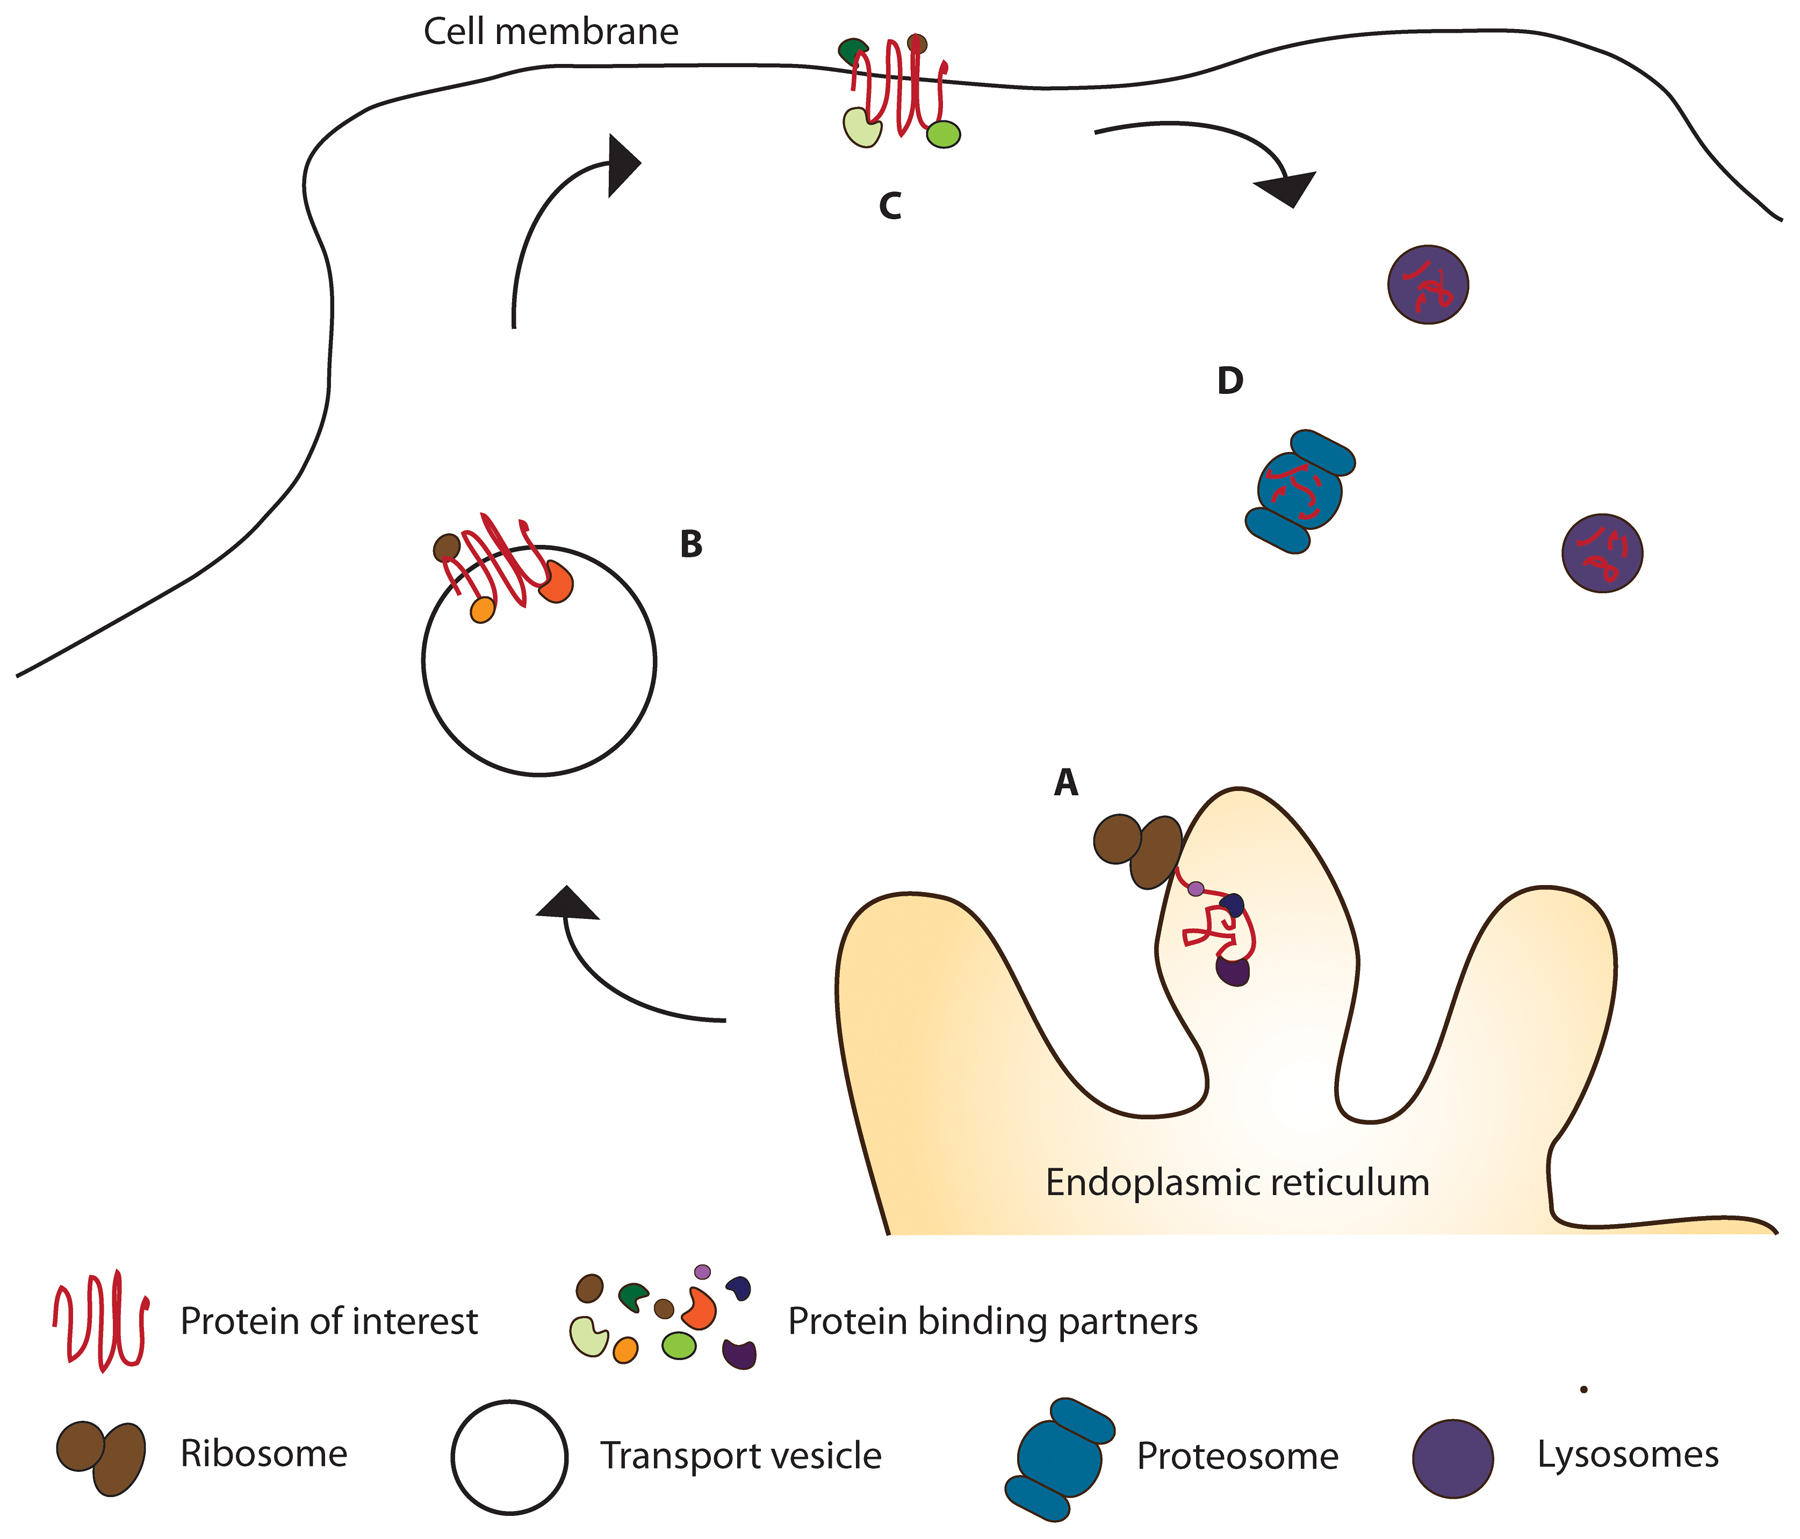
When performing a CoIP we are usually attempting to isolate the POI at a time when it is performing its function. Co-isolated proteins are thought to be similarly involved in that function. However, every protein also interacts with a large number of regulatory or “housekeeping” proteins during its defined lifecycle (Figure 3). Thus, when performing and interpreting results from a CoIP-MS experiment it is important to consider that a POI can be purified from all points within its lifecycle from synthesis to degradation. The co-immunoprecipitated lifecycle proteins should be identified as binding partners although they may not be of interest to the researcher. Proteins involved in protein synthesis (initiation and elongation factors, ribosomal proteins, etc.), protein folding (chaperones and heat shock proteins), and degradation (ubiquitin-associated proteins, etc.) will likely be identified in most CoIPs. For instance in our POI#1 case study (Table 2), we found many regulatory proteins (HSP-60, EFT-4, RPS-6, INF-1, and UBA-1) more abundant in the CoIP than the negative control.
|
Figure 3: The lifecycle of a protein determines protein interactions. A: Protein synthesized by ribosome; B: Protein modified and trafficked; C: Protein performing a function; D: Protein targeted for degradation.
An epitope can be purified from the time it is made (A) to the time it is degraded (D). Although the researcher may only be interested in functional binding partners and complexes (C), other “housekeeping” proteins and complexes (A, B, D) will also be purified and identified.
Table 2: List of identified proteins, spectral counts, and sequence coverages from GFP and ALP-1::GFP CoIPs-MS runs as the POI#1 case study. Error shown as standard deviations of spectral counts and sequence coverages from duplicate runs.
| Category | Gene | Control Spectral Counts | CoIP Spectral Counts | Control Sequence Coverage | CoIP Sequence Coverage |
|---|---|---|---|---|---|
| Target | alp-1 | 0 | 136 ± 5 | - | 33 ± 5% |
| Tag | gfp | 13 ± 6 | 8 ± 3 | 16 ± 8% | 25 ± 1% |
| Known binding partners | act-2 | 0 | 6202 ± 202 | - | 80 ± 4% |
| act-4 | 0 | 6377 ± 167 | - | 78 ± 2% | |
| act-1 | 0 | 6241 ± 72 | - | 76 ± 4% | |
| act-3 | 0 | 6241 ± 72 | - | 76 ± 4% | |
| unc-52 | 0 | 8510 ± 1083 | - | 72 ± 2% | |
| nmy-1 | 0 | 1236 ± 554 | - | 66 ± 7% | |
| myo-3 | 0 | 761 ± 25 | - | 58 ± 4% | |
| unc-89 | 0 | 28 ± 9 | - | 5 ± 2% | |
| lim-9 | 0 | 2 ± 0 | - | 4 ± 0% | |
| pat-2 | 0 | 3 ± 1 | - | 4 ± 2% | |
| pat-3 | 0 | 2 ± 1 | - | 3 ± 1% | |
| pat-4 | 0 | 4 ± 0 | - | 7 ± 2% | |
| Potential binding partner | tes-1 | 0 | 9 ± 4 | - | 18 ± 5% |
| Background (Bead, antibody, or tag) | tbb-2 | 404 ± 143 | 534 ± 273 | 53 ± 18% | 62 ± 24% |
| Background (Lifecycle) | hsp-60 | 19 ± 9 | 254 ± 84 | 10 ± 5% | 68 ± 10% |
| eft-4 | 38 ± 18 | 156 ± 58 | 10 ± 5% | 40 ± 14% | |
| rps-6 | 44 ± 21 | 88 ± 61 | 15 ± 7% | 43% ± 2% | |
| inf-1 | 8 ± 4 | 63 ± 28 | 5 ± 2% | 56 ± 22% | |
| uba-1 | 0 | 88 ± 44 | - | 33 ± 19% |
The interpretation of CoIP-MS results can also be aided by an understanding of potential sources of background proteins. Background proteins can generally be classified into two categories—random or systematic. Random background proteins can be introduced through small variations in sample preparation or analysis and may often be due to non-specific interactions with abundant proteins within the lysate. Additionally, both random background proteins and bona fide binding partners may be identified pseudo-randomly in replicate runs. This is due to the sensitive, but pseudo-random sampling of low abundance proteins/peptides using tandem MS in shotgun proteomic analysis of protein complexes (Liu et al., 2004). Generally, increasing the number of replicate runs allows for better separation of background noise and bona fide binding partners. This concept has been exploited in many computational analyses of protein complex data and is described in Section 8. Systematic background protein interactions present a greater, but surmountable challenge since they are reproducibly identified in all runs. The proper use of negative controls can reduce systematic noise through identification of background proteins that bind to the antibody, CoIP support (agarose, sepharose, magnetic beads, etc.), or purification tag (FLAG, GFP, etc.). For instance, performing a CoIP on an untagged lysate identifies proteins that bind the support and/or antibody. These background proteins can also be removed through tandem purification (Biochemistry and molecular biology) although at the expense of recovery and yield. For larger purification tags, such as GFP, a strain with GFP expressed from a transcriptional fusion could be used as a negative control. For instance in a case study of POI#1, tbb-2 was abundant in both GFP control and ALP-1::GFP runs indicating it either bound to the beads, antibody, or GFP tag. In our case study of POI#2, proteins purified from a strain lacking POI#2 likely bound to the beads or antibody. Thus, the negative control runs should account for any background proteins from the CoIP support and antibody. Another source of systematic background proteins can be introduced from co-purifying macromolecules. For instance in our case study of POI#1, ALP-1 is a known muscle-associated protein (Han and Beckerle, 2009; McKeown et al., 2006). Consequently, from our POI#1 CoIPs we identified muscle proteins (ACT-1, ACT-2, ACT-3, ACT-4, UNC-52, NMY-1, and MYO-3) with higher spectral counts than ALP-1 (Table 2). Similar results could be expected for CoIP of DNA-binding proteins (i.e., transcription factors) which pull down an abundance of histones via DNA (Figure 1C). In the case of DNA binding proteins, DNase or probe sonication can be used to remove DNA that would otherwise co-purify non-protein-protein interactions.
The combination of in-solution digestion and high-sensitivity MS analysis of protein complexes provides much greater sensitivity and comprehensiveness than traditional methods. These analytical characteristics provide the opportunity to identify weak, sub-stoichiometric, and transient protein interactions with a target protein, but also allow for identification of more background proteins. We will discuss statistical and comparative analyses that can aid in differentiating binding partners from background proteins in Section 8. Despite these bioinformatics methods to identify and remove background proteins, shotgun proteomic analysis will be more comprehensive and straightforward if protein complex purifications are relatively pure. As described in the next section, traditional biochemical and molecular biology methods can be used to evaluate and minimize background proteins in a CoIP preparation.
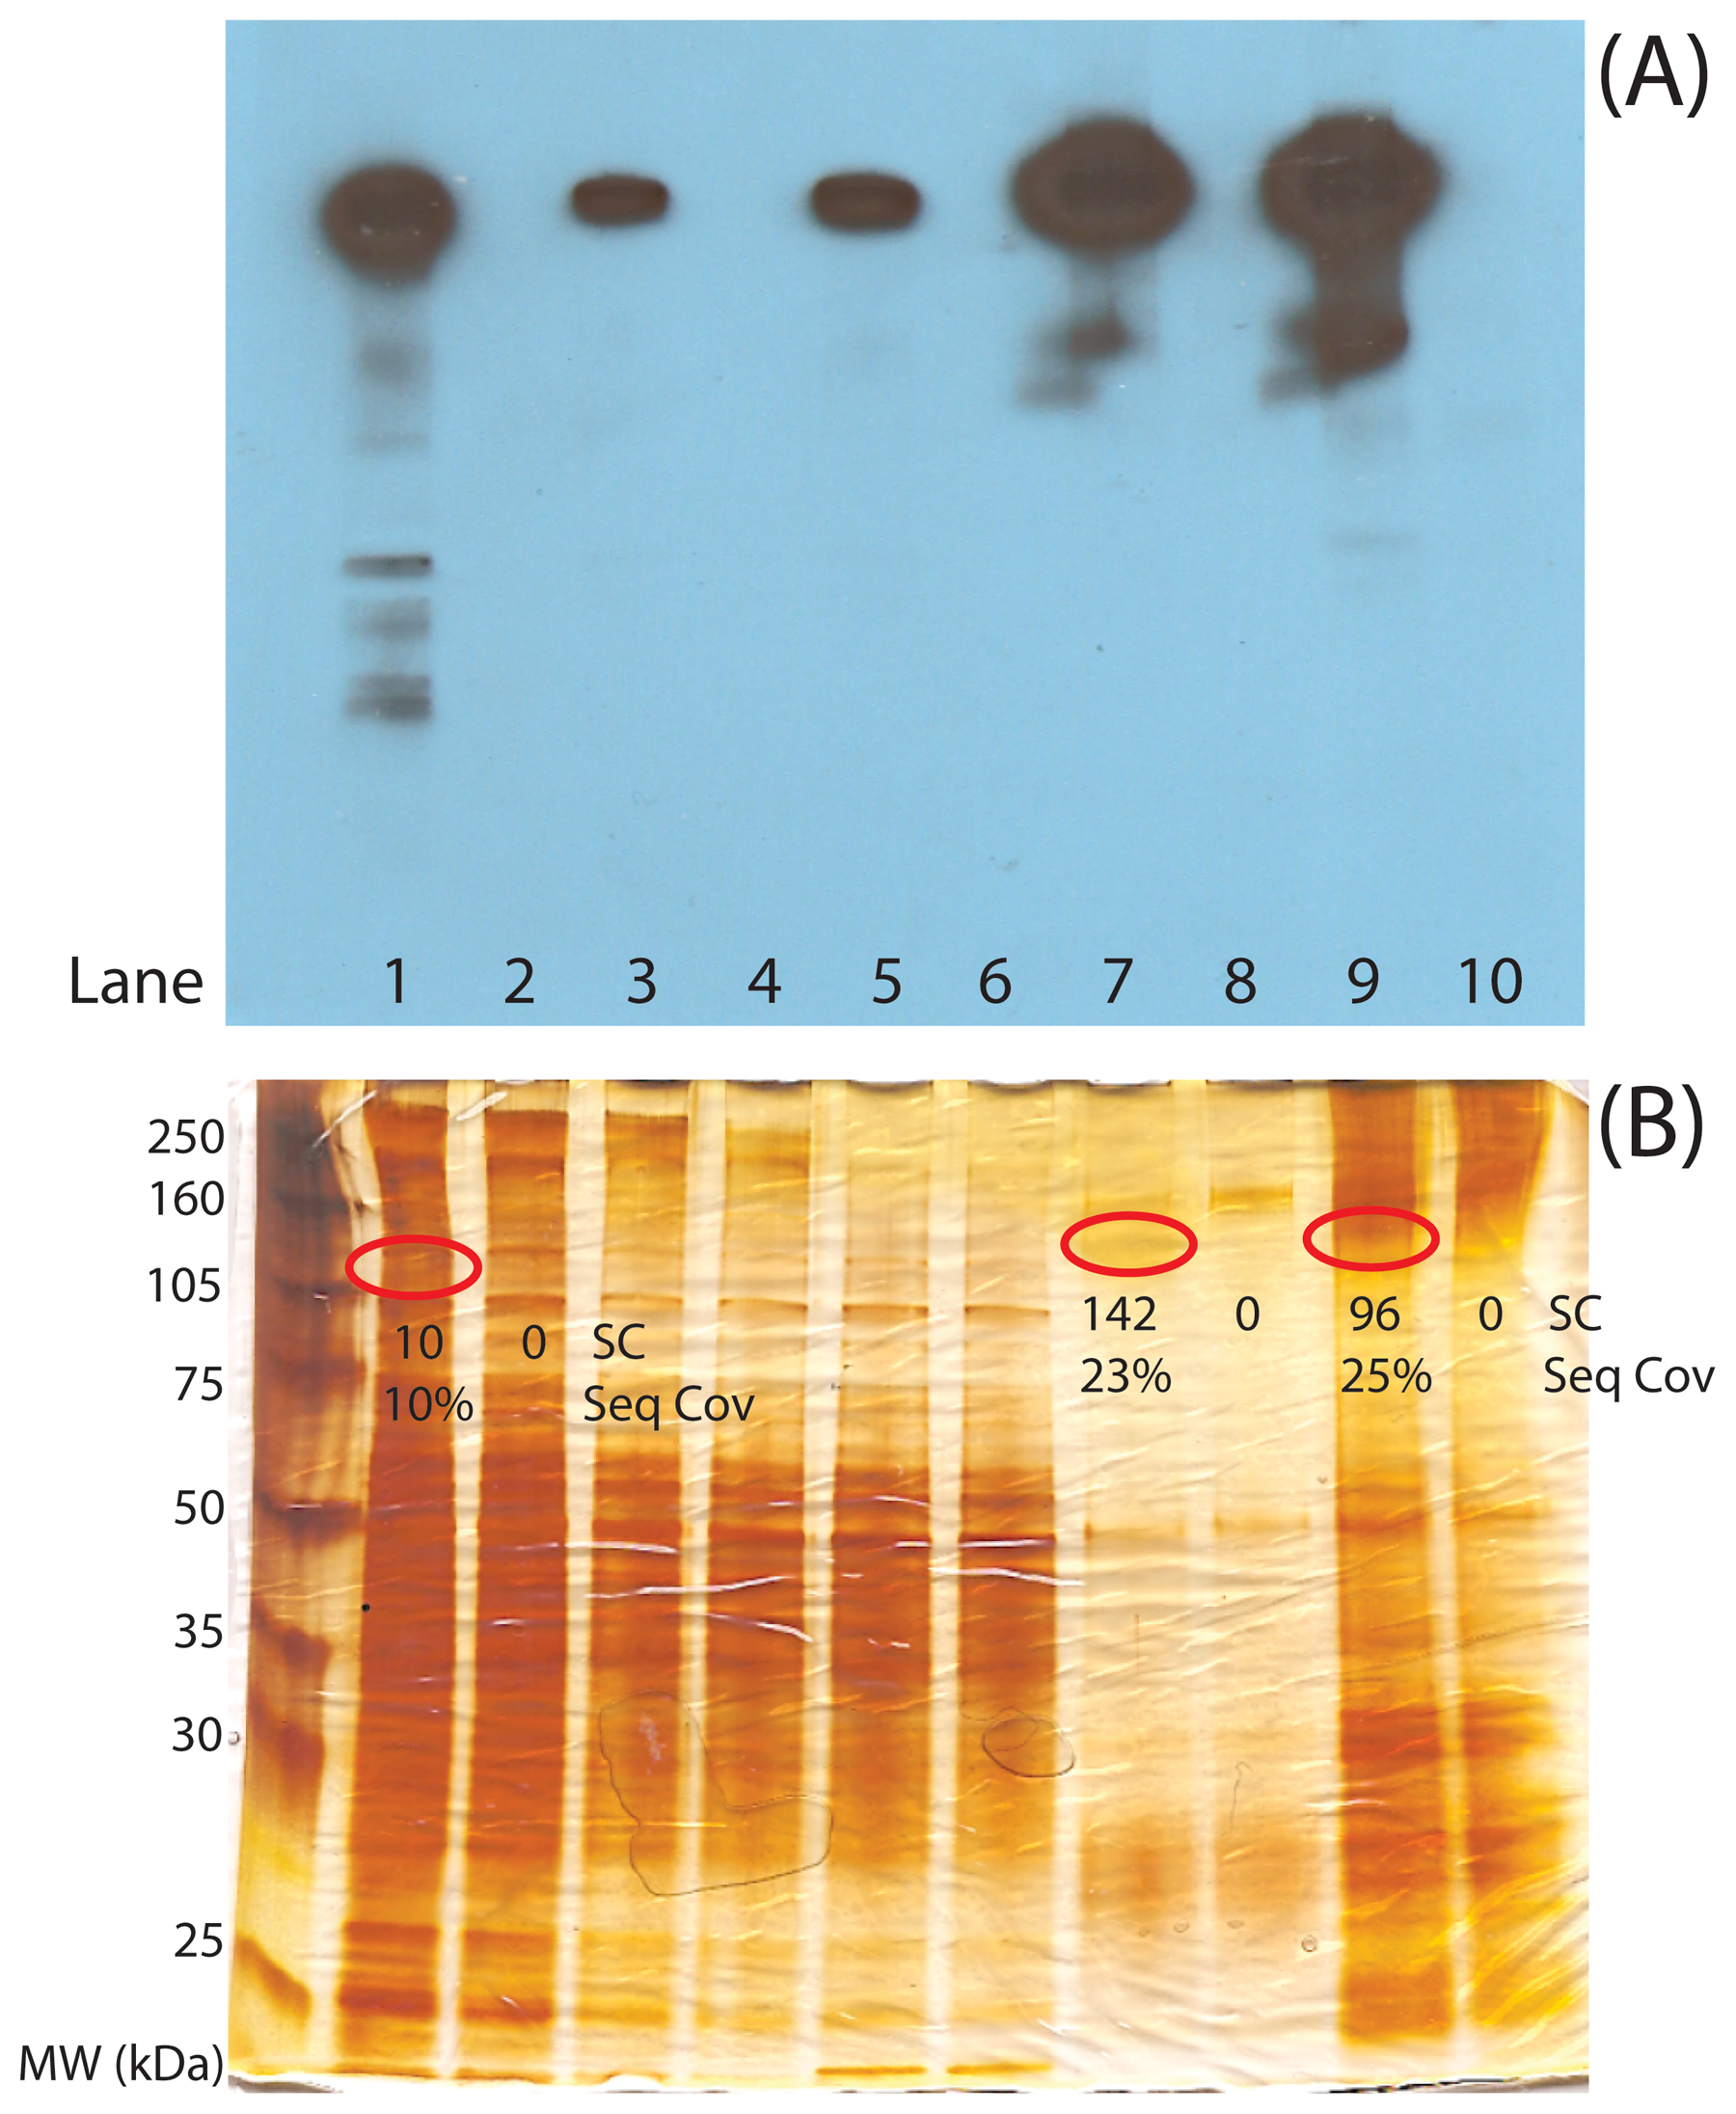
Two traditional methods can be used to ensure the success of a CoIP-MS experiment and minimize the time and cost associated with MS-based shotgun proteomic analyses. Western blotting analysis should primarily be used for ensuring the expression of the POI and tracking the POI throughout the CoIP process, as in Figure 4A. Depletion of POI#2 from the lysate can be observed by comparison of whole worm lysate (lane 1) to the CoIP supernatant (lanes 3 and 5), while enrichment can be detected by comparison of whole worm lysate to CoIP eluate (lanes 7 and 9).
|
Figure 4: Quality control gel analysis prior to mass spectrometric analysis. (A) Western blot analysis to track target POI#2 through the CoIP process. (B) Silver-stained gel analysis to track purification and abundance of the target POI#2 and binding partners through CoIP process. POI#2 silver-stained bands are marked based on the position in the Western blot. Protein spectral counts (SC) and sequence coverages (Seq Cov) for POI#2 are listed under each present or absent gel band to illustrate the relative detectability of POI#2 in the lysate (Lane 1), the CoIP with (Lane 7) and without (Lane 9) RNase treatment, and from the POI#2 negative control knock out strain (Lanes 2, 8, and 10). The gel lanes are the following: (1) N2 lysate, (2) Negative control lysate, (3) N2 CoIP supernatant, (4) Negative control CoIP supernatant, (5) N2 + RNAse treatment CoIP supernatant, (6) Negative control + RNase treatment CoIP supernatant, (7) N2 CoIP eluate, (8) Negative control CoIP eluate, (9) N2 + RNAse treatment CoIP eluate, and (10) Negative control + RNAse treatment CoIP eluate.
The analogous gel-based protein-staining analysis is also beneficial. Thus, we also suggest probing all proteins from lysates, CoIP supernatants, and 5–10% of the CoIP with coomassie- or silver-stained gel to estimate the purification and enrichment of the POI and its binding partners (Figure 4B). In this case, side-by-side comparison of the CoIP to the lysate (Figure 4B, compare lanes 7 and 9 to lane 1, respectively) allows for evaluation of the protein complex purity and POI#2 abundance. One of the main requirements for a successful CoIP-MS analysis is that a band with the approximate mass of your POI should be present in a gel-based analysis and be one of the most abundant proteins from the CoIP. Having ample abundance of the POI means that many potential binding partners are also likely present in detectable amounts (Figure 4B, lanes 7 and 9). Note that the appropriate negative control runs have been performed to establish that purified proteins are specific to POI#2 (Figure 4B, lanes 8 and 10). Gel-based analyses can serve to evaluate purity and yield. If the control and purification lanes are very similar then the CoIP is not pure. There are multiple experimental variables that can be tested. Suggested points in the CoIP pipeline to consider include: the expression of the protein in relevant strains, particularly if a POI is transgenically-tagged; the POI recovery from lysis; antibody integrity and conjugation to beads; and POI recovery from the CoIP. With a relatively pure and abundant POI from a CoIP, MS-based shotgun proteomics can now be performed to identify proteins and PTMs within the sample. Note that shotgun proteomic analysis is more sensitive if proteins are not cut out of gels and instead analyzed entirely in-solution (Das et al., 2010). Thus, the remaining 90% of a CoIP sample (after gel-based quality control experiments) can be subjected to in-solution tryptic digestion and shotgun proteomics analysis (Figure 2).
With many technological advances to mass spectrometers, MS analysis can be as sensitive as a Western blot for a POI. However, a common question we have encountered is “if my bait protein can be detected by Western, why is it not detected by shotgun proteomics?” There are two likely answers to this question. First, the main difference between a Western and shotgun proteomic analysis is detection selectivity. With a Western, as long as the antibody is specific, the other proteins present in the CoIP do not interfere with the detection of the POI or its binding partners. Thus a Western yields no relevant information about the purity of the CoIP. That is, Western results can appear essentially the same for a whole worm lysate (Figure 4A, lane 1) or for a highly pure protein complex (Figure 4A, lanes 7, and 9) since only POI#2 is detected. Shotgun proteomic analysis identifies peptides/proteins within a sample based on relative abundance. If the bait protein has not been purified and enriched from the other abundant proteins within the lysate, shotgun proteomic analysis will mostly identify the abundant background proteins and not the POI (Figure 4B, lane 1). Secondly, another major difference between Western and shotgun proteomic analysis is sensitivity. Although mass spectrometers are extremely sensitive, a peptide/protein signal is not amplifiable as in a Western analysis. Thus, even if a protein complex is pure and detectable by Western, it may not be detectable by MS.
Peptides are compatible with both nanoflow liquid chromatography (nLC) and tandem MS (MS/MS). Online multidimensional nLC/LC facilitates efficient separation and identification of modified and unmodified peptides. Mass spectrometers can be generally categorized as having either low or high resolution and mass accuracy. Resolution and accuracy define the capabilities to confidently measure the masses of peptides and their gas-phase fragments for sequencing. Currently utilized low-resolution instruments are primarily ion traps (Figure 2) and are regularly used for protein identification and some PTM identification. High-resolution instruments, such as the Orbitrap (Figure 2), can be used for all experiments. However, they are most beneficial in experiments to identify PTMs and quantitative experiments with isotopic labeling (Krijgsveld et al., 2003), although isotopic methods have yet to be applied to C. elegans CoIPs. Peptides are identified by matching experimentally-generated fragmentation spectra to theoretically-generated fragmentation spectra from protein sequence databases (Eng et al., 1994). Peptide matches from reversed protein sequences are appended to the database and can be used to measure false matches and control protein, peptide, and spectrum false discovery rates (FDR usually ~1% for proteins and ~0.1% for peptides). Higher mass accuracy measurement of intact peptide masses can be used as an additional filter to improve sensitivity, specificity, and confidence in peptide identifications with database searches (Yates et al., 2006). Peptide identifications serve as representations for protein and PTM identifications; thus, higher mass accuracy and higher confidence in peptide identifications also improve the sensitivity, specificity, and confidence in both protein and PTM identifications. This is illustrated in Table 3 where we have displayed the results of a protein database search including three common PTMs (phosphorylation, acetylation, and ubiquitination) with low resolution (LTQ) and high resolution (Orbitrap) data from replicate POI#1 CoIPs. A cursory look at the results would indicate that low resolution provides better results. Indeed the low resolution MS sampling is faster and thus more comprehensive over the same analysis time. Conversely, the high-resolution results are smaller and more stringent, but are of much higher confidence. This is the reason the low resolution MS instrument is often used for identifying proteins and the high-resolution instruments for confident PTM identification. To resolve this discrepancy, high-resolution MS instruments are consistently improving in speed and sensitivity to approach the comprehensiveness of low resolution instruments (Olsen et al., 2009).
Theoretically, 100% sequence coverage of a POI is possible since all possible peptide sequences are considered in the protein database search, including N-terminal, C-terminal, and internal peptides, along with multiple missed trypsin cleavage sites and sometimes non-tryptic peptides. Consideration of PTMs can also add to the overall protein sequence coverage. Practically, 50% protein sequence coverage is a reasonable result for a highly abundant protein in a CoIP sample, but is protein and sequence dependent. Protein sequence coverage is assigned by grouping the identified peptides to represent the minimum number of proteins that best explain the peptide sequences. Unique peptide sequences provide unambiguous evidence that a protein is present, while non-unique peptides contribute to protein sequence coverage and relative quantitation. Unique peptides are those that are not present in other proteins within the protein database. Conversely, non-unique peptides are those that are present within at least two proteins. Non-unique peptides often come from protein isoforms, but can also be present in redundant proteins. The number of unique peptides identified for a protein is dependent both on its sequence homology to other proteins within the protein database used and the abundance of the protein within the sample. Since proteins identified by unique peptides can share non-unique peptides, the non-unique peptides are often replicated and grouped within all relevant proteins. The appropriate grouping of peptides in shotgun proteomics is called the “Protein Inference Problem” (Nesvizhskii and Aebersold, 2005) and is generally addressed computationally. Although this can present identification and quantification challenges, the sensitivity, comprehensiveness, and power of shotgun proteomics in biological discovery has far exceeded any shortcomings from the analysis of proteins as a mixture of peptides. Additionally, the “Protein Inference Problem” is less of a challenge for simple mixtures, such as CoIPs described herein versus whole cell lysates; fewer non-unique peptides are actually present and identified within a sample of fewer proteins, making assignment of the non-unique peptides more straightforward.
Table 3: List of identified peptides, proteins, and modified peptides from replicate runs of the same sample with low and high resolution mass spectrometers. Database searches were controlled to the same peptide FDR (0.1%) with different peptide per protein requirements.
| Mass spectrometer | Linear ion trap (LTQ) | Orbitrap | ||
|---|---|---|---|---|
| Resolution & mass accuracy | Low | High | ||
| Required peptides per protein | 1 | 2 | 5 | 1* |
| *Peptides are required to be within 10 ppm of the expected mass. | ||||
| Peptides | 7,421 | 7,689 | 6,601 | 2,970 |
| Proteins | 1,344 | 868 | 453 | 707 |
| Phosphopeptides | 81 | 76 | 45 | 16 |
| Acetylated peptides | 84 | 97 | 70 | 31 |
| Ubiquitinated peptides | 61 | 52 | 32 | 2 |
Analysis of purified protein complexes of enough mass (high nanogram to low microgram) with MudPIT generally yield high protein sequence coverages (>50%) of the POI and its binding partners; although the ability to achieve high sequence coverages is POI and CoIP dependent. For instance, in both of our case studies we achieved approximately 30% sequence coverage (Figure 4B and Table 3). A benefit of high protein sequence coverage is a higher probability of identifying post-translationally modified peptides, even if substoichiometric. The most commonly searched and identified PTMs (Table 1) are phosphorylation, acetylation, ubiquitination, and methylation. Almost all PTMs can be identified using mass spectrometry with the appropriate sample preparation and analysis considerations (Zhang et al., 2013), but this is outside the scope of this chapter. The measurement of both peptide precursor and fragment ion masses allows for identification and localization of many types of PTMs on proteins. That is, the modification mass can typically be detected on both the intact peptide and on the fragments to confirm the PTM identity and site of modification. An example phosphopeptide with phosphorylation site localization is shown in Figure 2 (lower left). Trypsin is primarily used for proteolytic digestions of protein complexes and can provide excellent protein sequence coverages and identification of most PTMs. For regions of proteins that have too many or too few tryptic cleavage sites, other less-selective proteases, such as subtilisin and elastase, can be used to improve protein sequence and PTM coverage (MacCoss et al., 2002; Fonslow and Yates, 2012).
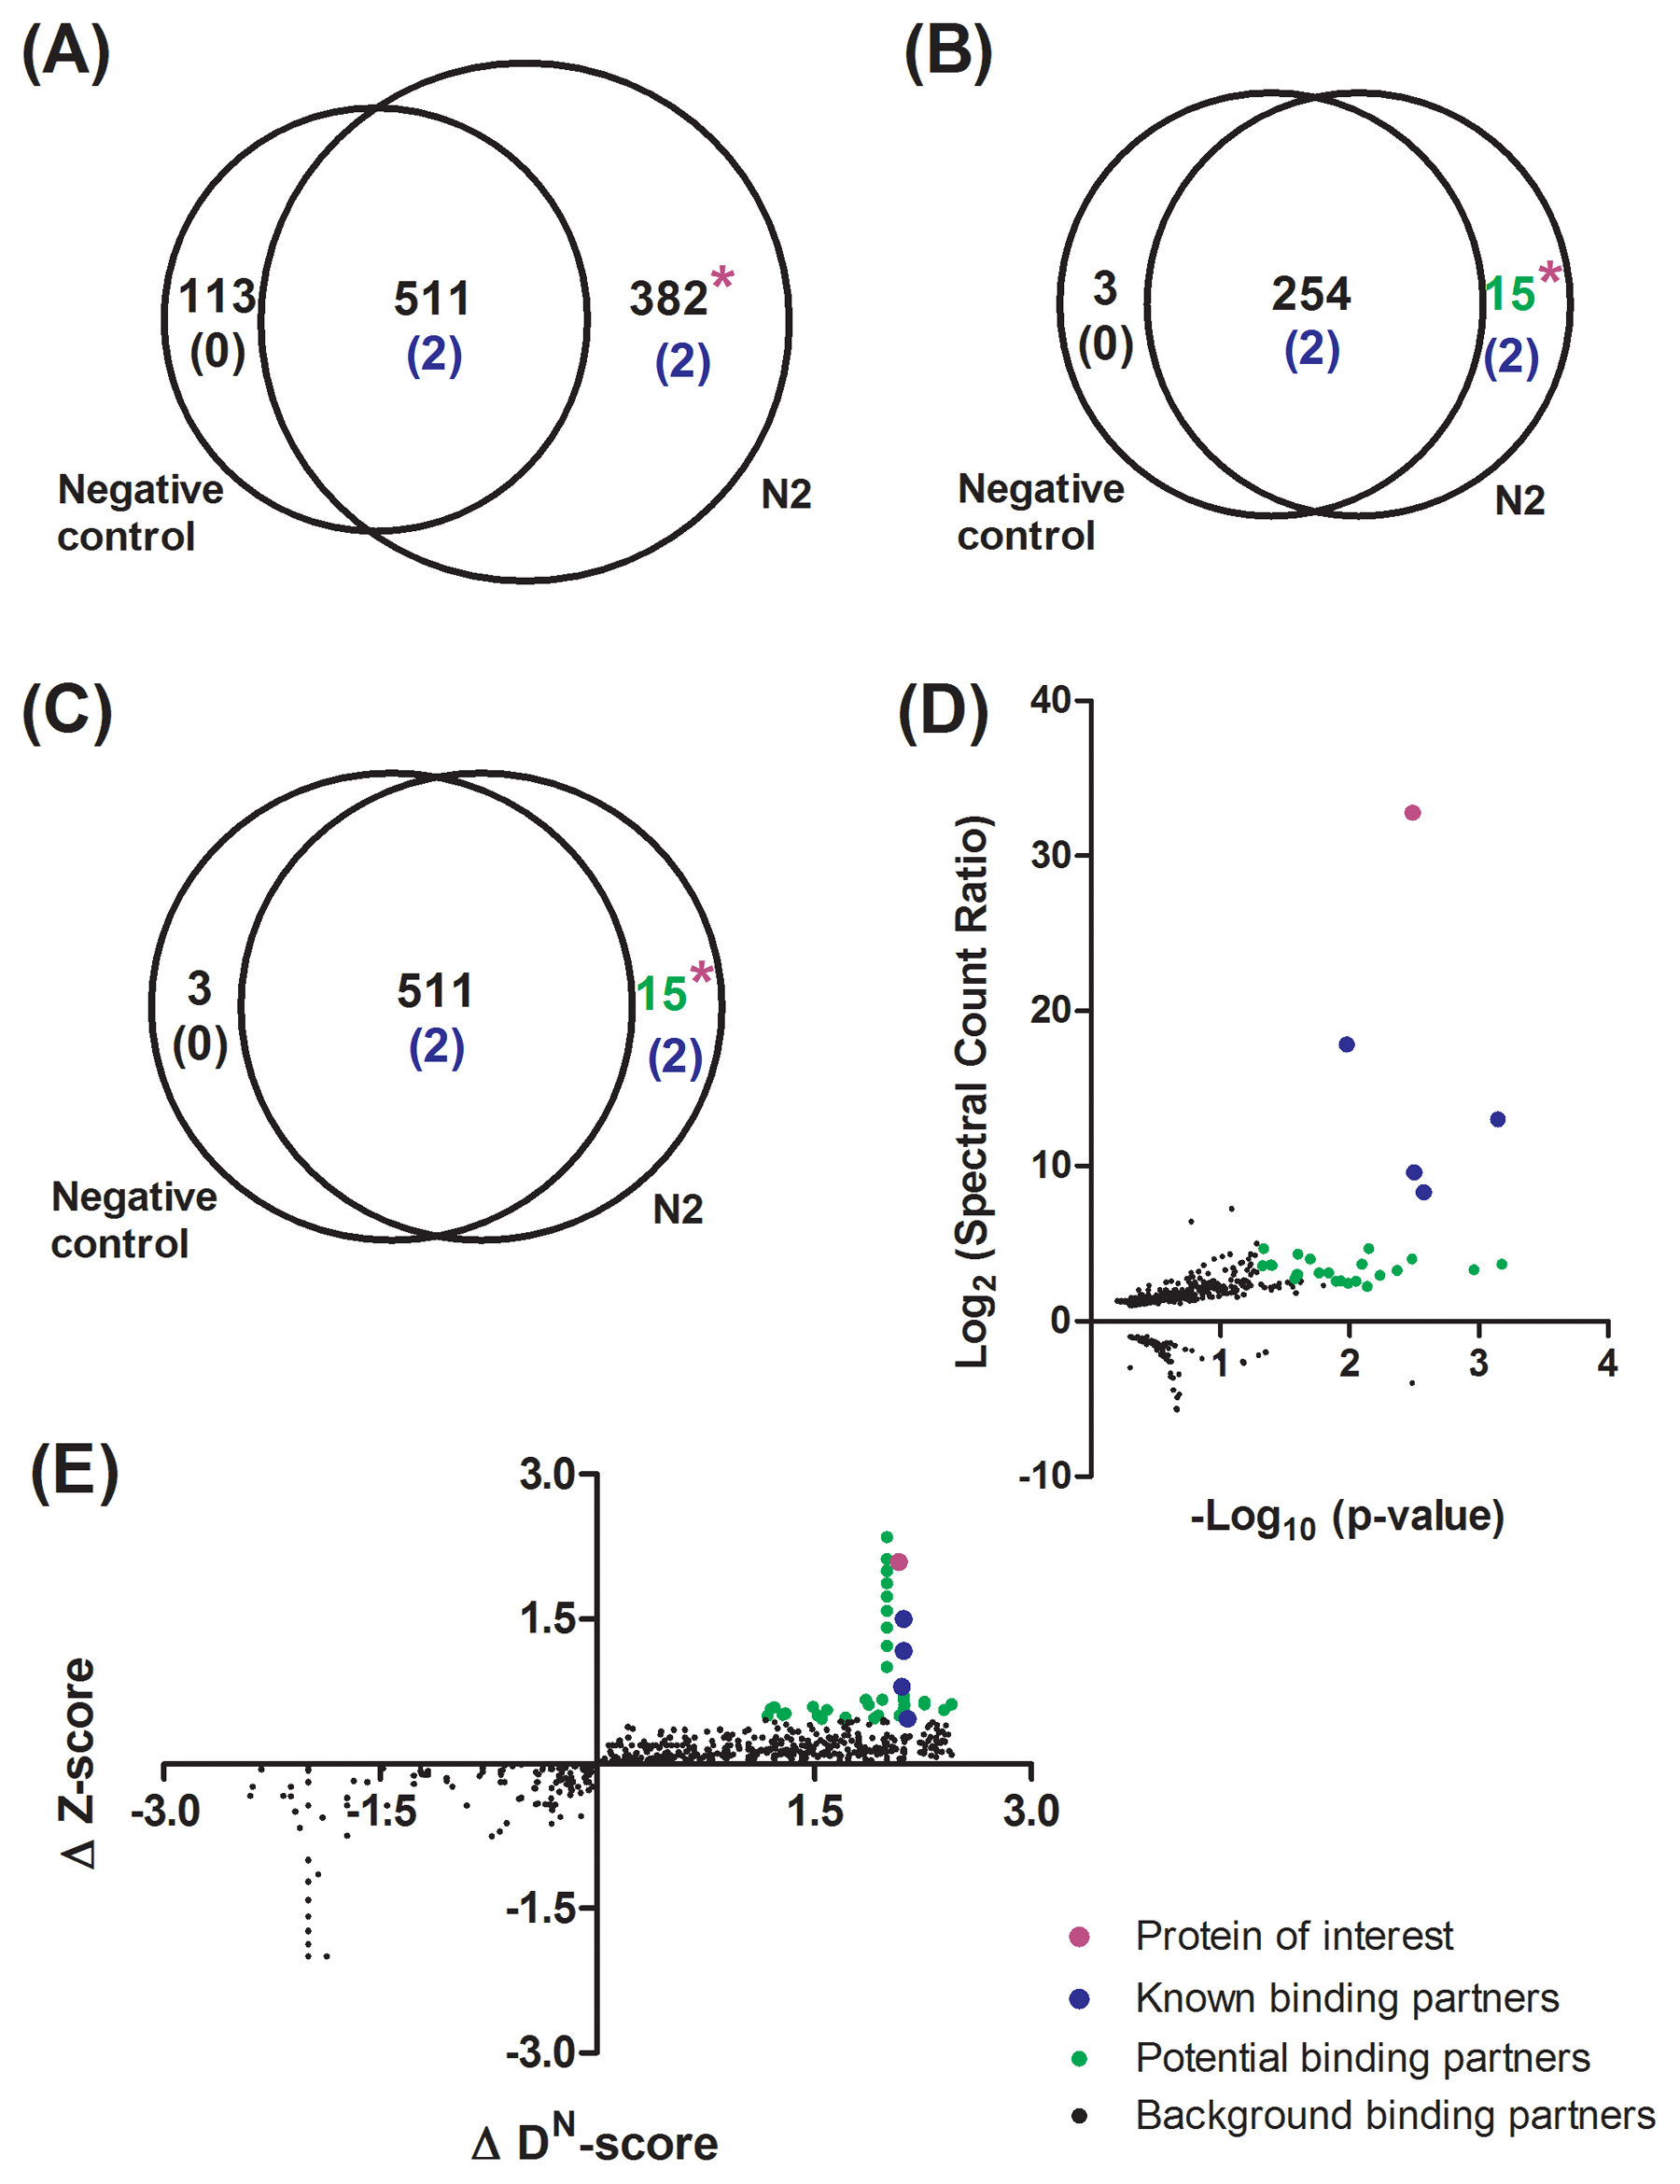
Shotgun proteomics provides an effective means to identify proteins and PTMs within a sample from a CoIP. The most abundant and readily identified proteins from a database search of a CoIP-MS run should be from bona fide protein interactions. Thus, the quality of CoIP-MS results can, in part, be quickly and manually confirmed by the presence of known protein binding partners, if available. Generally these results are difficult to interpret unless compared to the appropriate negative control or conditional CoIP runs. There are both simple and complex methods for comparing CoIP-MS results, mostly dependent on the scale, depth, and complexity of analyses. The simplest analysis is a pairwise Venn comparison. This comparison may be most similar to a gel-based comparison since either the presence or absence of a protein is considered (Tabb et al., 2002; Carvalho et al., 2008); since shotgun proteomics is more sensitive than gel-based analysis, the depth of the comparison is greater and more informative. For instance, the number of proteins uniquely found using shotgun proteomic Venn comparison of POI#2 (Figure 5A) is much greater than those visible using a gel-based analysis (Lanes 7 and 9 in Figure 4B). Often, for strongly associated, robust binding partners this simple Venn analysis easily reveals these interactions for further follow-up and characterization. This is illustrated by the two known binding partners that were only present in the CoIP (Figure 5A). The consideration of protein identification reproducibility, either by identification frequency (Figure 5B) or p-value (Figure 5C), between CoIP replicate analyses can also be included in a Venn comparison to further increase confidence in binding partner candidates (Carvalho et al., 2011). From these more stringent considerations, the same 15 proteins were only found in POI#2 CoIPs (Figures 5B and 5C) and could be considered for biological validation. Similarly, proteins that are identified in only the negative control experiments yield a rough estimate of the background noise in the analyses. The noise can be better modeled by high-level statistical methods, but by considering identification frequency (Figure 5B) and p-value (Figure 5C) the noise is reduced from 113 proteins (Figure 5A) to only three proteins. Ideally there will be more proteins unique to the POI CoIP, than the negative control CoIP. Similarly, these methods can be applied to find changes in binding partners between conditional treatments. However, subtle differences can be hard to detect with this method and generally require higher-level analyses. Additionally, these Venn analysis methods can break down if the POI or bona fide binding partners are abundant and are also detected to a limited extent in negative control experiments. A few proteins from our POI#1 case study are shown in Table 2 as examples from a Venn comparison. As in our POI#2 case study (Figure 4B), we achieved a reasonable number of spectral counts (136 ± 5) and sequence coverage (33 ± 5%) for our POI#1, ALP-1. Additionally, we identified a number of expected binding partners with even higher spectral counts and sequence coverages, presumably due to their macromolecular, polymeric nature. The identified actin isoforms (ACT-1–4) highlight that homologous proteins can be a challenge to differentiate with shotgun proteomics since they are not analyzed in their intact form. Redundant peptides can indicate at least one of the isoforms is present, but unique peptides must be identified to determine which isoform is present. If we were interested in quantifying the relative abundances of actin isoforms, the use of dNSAF instead of spectral counting would be ideally suited. Using this simple analysis method, we found a potential ALP-1 binding partner, TES-1, a LIM-domain binding protein, which was not present in the GFP control runs.
|
Figure 5: Computational comparison of CoIP results for identification of candidate binding partners for biological follow-up. Venn diagrams of identified proteins from triplicate analysis of N2 and negative control CoIPs considering proteins identified in (A) only one replicate, (B) all three replicates, and (C) with statistical significance (p < 0.05) based on spectral counts and replicate frequency. *Denotes the location of the POI in the Venn diagram. Colored numbers indicate either the number of known binding partners (blue) or potential binding partners (green). (D) Comparison of the abundance fold-change in proteins based on spectral count ratio and statistical significance (p < 0.05) of the fold-change by dividing N2 protein spectral counts by negative control protein spectral counts. A value of 1 is used for proteins not present in either sample with no spectral counts. Proteins with the highest positive fold-change are the POI (magenta), known binding partners (blue), and potential binding partners (green) above background binding partners (black). (E) Comparison of identified protein confidence values from CompPASS. Protein confidence scores from negative control runs are subtracted from N2 protein confidence scores. The POI (magenta) and known binding partners (blue) cluster in the upper right portion of the graph to reveal potential binding partners (green) over background binding partners (black).
Adding another level of complexity to the analysis, the relative abundance of proteins can also be considered between samples instead of simply considering absence or presence in the CoIP. This type of analysis considers changes in proteins that are present reproducibly in both samples within the overlap of the Venn diagrams (Figures 5B and 5C) and can be used for comparisons with negative controls or conditional CoIPs. Protein abundances for comparison between samples are estimated using peptide spectral counts (Liu et al., 2004)—the number of times spectra are identified for a protein, similar to transcript microarray abundance values (Pavelka et al., 2008) or mRNA reads in RNA-Seq—and can be normalized to protein length by a normalized spectral abundance factor (NSAF) (Zybailov et al., 2006). The use of NSAF facilitates comparison of relative abundances of different proteins within the same sample. Since many proteins share peptide sequences, distributing shared peptide spectral counts among redundant proteins yields a distributed NSAF (dNSAF) that provides further improvements to estimate relative abundances within a sample, particularly for different proteoforms (Zhang et al., 2010). In this case, comparison of protein relative abundances using spectral counting is used to find candidate binding partners. A Volcano plot considers both the fold-change of relative protein abundances and the significance of the fold-change as a p-value. By comparison of triplicate POI#2 CoIPs to negative control CoIPs with a Volcano plot (Figure 5D), the expected proteins (POI#2 and known binding partners) have the highest and most significant fold-changes, revealing other potential binding partners with high significance and lower fold-changes. Changes in protein binding partners could also be evaluated using this method by comparison of conditional treated and untreated POI CoIP results. Each level of comparison provides a means to narrow and refine candidate binding partners to testable, physiologically relevant, bona fide binding partners.
Even more sophisticated analyses provide greater confidence in binding partners. Through statistical considerations of multiple experimental variables, bona fide binding partners are more easily differentiated from background noise (Krogan et al., 2006; Choi et al., 2011; Jager et al., 2012). Standard triplicate analyses facilitate statistical considerations of experimental error with the majority of these methods. However, power law global error modeling of spectral counting data has shown the largest gain in both accuracy and precision when an additional fourth replicate is performed, with diminishing returns from more replicates (Pavelka et al., 2008). We have analyzed our triplicate case-study POI#2 CoIP data using CompPASS (Figure 5E). CompPASS considers the uniqueness, abundance, and reproducibility of proteins within parallel runs by establishing a threshold that is inherent to the sampling of mass spectrometry-based shotgun proteomic analysis (Sowa et al., 2009). Similar to the Volcano plot comparison, POI#2, known binding partners, and candidate binding partners cluster within the plot. These candidates can then be used for biological follow-up.
Mass spectrometry-based proteomics provides a powerful tool to study C. elegans proteins. Remarkable results have routinely emerged from genetic and RNAi studies in C. elegans, particularly when combined with enabling technologies. Mass spectrometry-based proteomics is following a similar, enabling trend and we hope to continue facilitating these studies. Through our own work and collaborations with C. elegans biologists we have learned the power of these analyses, along with some of the common pitfalls, challenges, and misconceptions; we have explained and addressed these recurring topics to advance this area of research. We envision this chapter bridging a gap between C. elegans biologists and protein mass spectrometrists, acting as a guide for C. elegans protein complex preparation, shotgun proteomic analysis, data interpretation, and troubleshooting.
CoIP-MS – co-immunoprecipitation followed by mass spectrometry
dNSAF – distribution normalized spectral abundance factor; a relative measure of protein abundance that considers the shared sequences between homologous and redundant proteins by distributing spectral counts.
MS/MS – tandem mass spectrometry; mass spectra are acquired on both intact and fragmented peptide ions to sequence the peptide.
MudPIT – Multidimensional Protein Identification Technology
NSAF – normalized spectral abundance factor; a normalized relative measure of protein abundance that considers the length of proteins by dividing the spectral counts by the protein sequence length.
POI – protein of interest
Protein complex isoforms (complexoforms) – protein complexes composed of similar subcomplexes (cores, attachments, and modules) that confer different biological functions.
Protein complex attachments – stable protein subcomplexes that are unique to protein complexoforms.
Protein complex cores – stable protein subcomplexes that are promiscuously found in many similar protein complexoforms.
Protein complex modules – small, stable protein subcomplexes that assemble into attachments.
Protein isoforms – different forms of the same protein from related genes, single nucleotide polymorphisms, or alternative RNA splicing.
Proteoforms – different forms of the same protein arising from both protein isoforms and differential PTMs.
PTM – post-translational modification.
Reversed peptide and protein sequence – reversed sequences are appended to forward sequences in a protein database to estimate noise and false forward peptide and protein matches from the database search.
Sequence coverage – percentage of a protein that is sequenced in a shotgun proteomics run by reconstruction of the protein sequence from identified peptides.
Spectral count – the number of times peptides are sampled and identified by MS/MS for a given protein; a relative measure of protein abundance similar to transcript sequence counting.
B.R.F, J.J.M., P.T., and J.R.Y. are supported by the US National Center for Research Resources (5P41RR011823-17), National Institute of General Medical Sciences (8P41GM103533-17), National Institute of Diabetes and Digestive and Kidney Diseases (R01DK074798), National Heart, Lung, and Blood Institute (HHSN268201000035C), and National Institute of Mental Health (R01MH067880). A.P.A. is supported by the Sigrid Jusélius Foundation and A.E.P. is supported by the NIH (GM071654), Keck, and Peter Gruber Foundations.
Ahringer, J., ed. Reverse genetics (April 6, 2006), WormBook, ed. The C. elegans Research Community, WormBook, doi/10.1895/wormbook.1.47.1, http://www.wormbook.org.
Ashrafi, K. Obesity and the regulation of fat metabolism (March 9, 2007), WormBook, ed. The C. elegans Research Community, WormBook, doi/10.1895/wormbook.1.130.1, http://www.wormbook.org.
Audhya, A., and Desai, A. (2008). Proteomics in Caenorhabditis elegans. Brief. Funct. Genomic Proteomic 7, 205-210. Abstract Article
Audhya, A., Hyndman, F., McLeod, I.X., Maddox, A.S., Yates, J.R., 3rd., Desai, A., and Oegema, K. (2005). A complex containing the Sm protein CAR-1 and the RNA helicase CGH-1 is required for embryonic cytokinesis in Caenorhabditis elegans. J Cell Biol. 171, 267-279. Abstract Article
Audhya, A., McLeod, I.X., Yates, J.R., and Oegema, K. (2007). MVB-12, a fourth subunit of metazoan ESCRT-I, functions in receptor downregulation. PloS One 2, e956. Abstract Article
Babu, M., Vlasblom, J., Pu, S., Guo, X., Graham, C., Bean, B.D., Burston, H.E., Vizeacoumar, F.J., Snider, J., Phanse, S., et al. (2012). Interaction landscape of membrane-protein complexes in Saccharomyces cerevisiae. Nature 489, 585-589. Abstract Article
Boxem, M., Maliga, Z., Klitgord, N., Li, N., Lemmens, I., Mana, M., de Lichtervelde, L., Mul, J.D., van de Peut, D., Devos, M., et al. (2008). A protein domain-based interactome network for C. elegans early embryogenesis. Cell 134, 534-545. Abstract Article
Carvalho, P.C., Fischer, J.S., Chen, E.I., Yates, J.R., 3rd., and Barbosa, V.C. (2008). PatternLab for proteomics: a tool for differential shotgun proteomics. BMC bioinformatics 9, 316. Abstract Article
Carvalho, P.C., Fischer, J.S., Perales, J., Yates, J.R., Barbosa, V.C., and Bareinboim, E. (2011). Analyzing marginal cases in differential shotgun proteomics. Bioinformatics 27, 275-276. Abstract Article
Cheeseman, I.M., MacLeod, I., Yates, J.R., 3rd., Oegema, K., and Desai, A. (2005). The CENP-F-like proteins HCP-1 and HCP-2 target CLASP to kinetochores to mediate chromosome segregation. Curr. Biol. 15, 771-777. Abstract Article
Choi, H., Larsen, B., Lin, Z.Y., Breitkreutz, A., Mellacheruvu, D., Fermin, D., Qin, Z.S., Tyers, M., Gingras, A.C., and Nesvizhskii, A.I. (2011). SAINT: probabilistic scoring of affinity purification-mass spectrometry data. Nat. Methods 8, 70-73. Abstract Article
Chu, D.S., Liu, H., Nix, P., Wu, T.F., Ralston, E.J., Yates, J.R., 3rd., and Meyer, B.J. (2006). Sperm chromatin proteomics identifies evolutionarily conserved fertility factors. Nature 443, 101-105. Abstract Article
Collins, S.R., Kemmeren, P., Zhao, X.C., Greenblatt, J.F., Spencer, F., Holstege, F.C., Weissman, J.S., and Krogan, N.J. (2007). Toward a comprehensive atlas of the physical interactome of Saccharomyces cerevisiae. Mol. Cell. Proteomics 6, 439-450. Abstract Article
Csankovszki, G., Collette, K., Spahl, K., Carey, J., Snyder, M., Petty, E., Patel, U., Tabuchi, T., Liu, H., McLeod, I., et al. (2009). Three distinct condensin complexes control C. elegans chromosome dynamics. Curr. Biol. 19, 9-19. Abstract Article
Dammermann, A., Pemble, H., Mitchell, B.J., McLeod, I., Yates, J.R., 3rd., Kintner, C., Desai, A.B., and Oegema, K. (2009). The hydrolethalus syndrome protein HYLS-1 links core centriole structure to cilia formation. Genes Dev. 23, 2046-2059. Abstract Article
Das, S., Bosley, A.D., Ye, X., Chan, K.C., Chu, I., Green, J.E., Issaq, H.J., Veenstra, T.D., and Andresson, T. (2010). Comparison of strong cation exchange and SDS-PAGE fractionation for analysis of multiprotein complexes. J. Proteome Res. 9, 6696-6704. Abstract Article
Dong, M.Q., Venable, J.D., Au, N., Xu, T., Park, S.K., Cociorva, D., Johnson, J.R., Dillin, A., and Yates, J.R., 3rd. (2007). Quantitative mass spectrometry identifies insulin signaling targets in C. elegans. Science 317, 660-663. Abstract Article
Duchaine, T.F., Wohlschlegel, J.A., Kennedy, S., Bei, Y., Conte, D., Jr., Pang, K., Brownell, D.R., Harding, S., Mitani, S., Ruvkun, G., et al. (2006). Functional proteomics reveals the biochemical niche of C. elegans DCR-1 in multiple small-RNA-mediated pathways. Cell 124, 343-354. Abstract Article
Eng, J.K., McCormack, A.L., and Yates, J.R., 3rd. (1994). An approach to correlate tandem mass spectral data of peptides with amino acid sequences in a protein database. J. Am. Soc. Mass Spectrom. 5, 976-989. Abstract Article
Ewing, R.M., Chu, P., Elisma, F., Li, H., Taylor, P., Climie, S., McBroom-Cerajewski, L., Robinson, M.D., O'Connor, L., Li, M., et al. (2007). Large-scale mapping of human protein-protein interactions by mass spectrometry. Mol. Syst. Biol. 3, 89. Abstract Article
Fonslow, B.R., Kang, S.A., Gestaut, D.R., Graczyk, B., Davis, T.N., Sabatini, D.M., and Yates, J.R., 3rd. (2010). Native capillary isoelectric focusing for the separation of protein complex isoforms and subcomplexes. Anal. Chem. 82, 6643-6651. Abstract Article
Fonslow, B.R., and Yates, J.R., 3rd. (2012). Proteolytic Digestion Methods for Shotgun Proteomics. In Comprehensive Sampling and Sample Preparation, Volume 3, Janusz Pawliszyn, Editor-in-Chief. (Oxford: Academic Press), pp. 261-276.
Gassmann, R., Essex, A., Hu, J.S., Maddox, P.S., Motegi, F., Sugimoto, A., O'Rourke, S.M., Bowerman, B., McLeod, I., Yates, J.R., 3rd., et al. (2008). A new mechanism controlling kinetochore-microtubule interactions revealed by comparison of two dynein-targeting components: SPDL-1 and the Rod/Zwilch/Zw10 complex. Genes Dev. 22, 2385-2399. Abstract Article
Gavin, A.C., Aloy, P., Grandi, P., Krause, R., Boesche, M., Marzioch, M., Rau, C., Jensen, L.J., Bastuck, S., Dumpelfeld, B., et al. (2006). Proteome survey reveals modularity of the yeast cell machinery. Nature 440, 631-636. Abstract Article
Gavin, A.C., Bosche, M., Krause, R., Grandi, P., Marzioch, M., Bauer, A., Schultz, J., Rick, J.M., Michon, A.M., Cruciat, C.M., et al. (2002). Functional organization of the yeast proteome by systematic analysis of protein complexes. Nature 415, 141-147. Abstract
Gottschalk, A., Almedom, R.B., Schedletzky, T., Anderson, S.D., Yates, J.R., 3rd., and Schafer, W.R. (2005). Identification and characterization of novel nicotinic receptor-associated proteins in Caenorhabditis elegans. EMBO J. 24, 2566-2578. Abstract Article
Grill, B., Bienvenut, W.V., Brown, H.M., Ackley, B.D., Quadroni, M., and Jin, Y. (2007). C. elegans RPM-1 regulates axon termination and synaptogenesis through the Rab GEF GLO-4 and the Rab GTPase GLO-1. Neuron 55, 587-601. Abstract Article
Gu, W., Shirayama, M., Conte, D., Jr., Vasale, J., Batista, P.J., Claycomb, J.M., Moresco, J.J., Youngman, E.M., Keys, J., Stoltz, M.J., et al. (2009). Distinct argonaute-mediated 22G-RNA pathways direct genome surveillance in the C. elegans germline. Mol. Cell 36, 231-244. Abstract Article
Han, H.F., and Beckerle, M.C. (2009). The ALP-Enigma protein ALP-1 functions in actin filament organization to promote muscle structural integrity in Caenorhabditis elegans. Mol. Biol. Cell 20, 2361-2370. Abstract Article
Havugimana, P.C., Hart, G.T., Nepusz, T., Yang, H., Turinsky, A.L., Li, Z., Wang, P.I., Boutz, D.R., Fong, V., Phanse, S., et al. (2012). A census of human soluble protein complexes. Cell 150, 1068-1081. Abstract Article
He, Y., Beatty, A., Han, X., Ji, Y., Ma, X., Adelstein, R.S., Yates, J.R., 3rd., Kemphues, K., and Qi, L. (2012). Nonmuscle myosin IIB links cytoskeleton to IRE1α signaling during ER stress. Dev. Cell 23, 1141-1152. Abstract Article
Heck, A.J. (2008). Native mass spectrometry: a bridge between interactomics and structural biology. Nat. Methods 5, 927-933. Abstract Article
Jager, S., Cimermancic, P., Gulbahce, N., Johnson, J.R., McGovern, K.E., Clarke, S.C., Shales, M., Mercenne, G., Pache, L., Li, K., et al. (2012). Global landscape of HIV-human protein complexes. Nature 481, 365-370. Abstract Article
Jedamzik, B., and Eckmann, C.R. (2009). Analysis of in vivo protein complexes by coimmunoprecipitation from Caenorhabditis elegans. Cold Spring Harb. Protoc. 2009, pdb prot5299. Abstract Article
Krijgsveld, J., Ketting, R.F., Mahmoudi, T., Johansen, J., Artal-Sanz, M., Verrijzer, C.P., Plasterk, R.H., and Heck, A.J. (2003). Metabolic labeling of C. elegans and D. melanogaster for quantitative proteomics. Nature Biotechnol. 21, 927-931. Abstract
Krogan, N.J., Cagney, G., Yu, H., Zhong, G., Guo, X., Ignatchenko, A., Li, J., Pu, S., Datta, N., Tikuisis, A.P., et al. (2006). Global landscape of protein complexes in the yeast Saccharomyces cerevisiae. Nature 440, 637-643. Abstract Article
Liu, H., Sadygov, R.G., and Yates, J.R., 3rd. (2004). A model for random sampling and estimation of relative protein abundance in shotgun proteomics. Anal. Chem. 76, 4193-4201. Abstract Article
MacCoss, M.J., McDonald, W.H., Saraf, A., Sadygov, R., Clark, J.M., Tasto, J.J., Gould, K.L., Wolters, D., Washburn, M., Weiss, A., et al. (2002). Shotgun identification of protein modifications from protein complexes and lens tissue. Proc. Natl. Acad. Sci. U. S. A. 99, 7900-7905. Abstract Article
McKeown, C.R., Han, H.F., and Beckerle, M.C. (2006). Molecular characterization of the Caenorhabditis elegans ALP/Enigma gene alp-1. Developmental Dyn. 235, 530-538. Abstract Article
Min, J., Kyung Kim, Y., Cipriani, P.G., Kang, M., Khersonsky, S.M., Walsh, D.P., Lee, J.Y., Niessen, S., Yates, J.R., 3rd., Gunsalus, K., et al. (2007). Forward chemical genetic approach identifies new role for GAPDH in insulin signaling. Nat. Chem. Biol. 3, 55-59. Abstract Article
Moresco, J.J., Carvalho, P.C., and Yates, J.R., 3rd. (2010). Identifying components of protein complexes in C. elegans using co-immunoprecipitation and mass spectrometry. J. Proteomics 73, 2198-2204. Abstract Article
Nesvizhskii, A.I., and Aebersold, R. (2005). Interpretation of shotgun proteomic data: the protein inference problem. Mol. Cell. Proteomics 4, 1419-1440. Abstract Article
Olsen, J.V., Schwartz, J.C., Griep-Raming, J., Nielsen, M.L., Damoc, E., Denisov, E., Lange, O., Remes, P., Taylor, D., Splendore, M., et al. (2009). A dual pressure linear ion trap Orbitrap instrument with very high sequencing speed. Mol. Cell. Proteomics 8, 2759-2769. Abstract Article
Olson, S.K., Bishop, J.R., Yates, J.R., Oegema, K., and Esko, J.D. (2006). Identification of novel chondroitin proteoglycans in Caenorhabditis elegans: embryonic cell division depends on CPG-1 and CPG-2. J. Cell Biol. 173, 985-994. Abstract Article
Page, A.P. and Johnstone, I.L. The cuticle (March 19, 2007), WormBook, ed. The C. elegans Research Community, WormBook, doi/10.1895/wormbook.1.138.1, http://www.wormbook.org.
Pavelka, N., Fournier, M.L., Swanson, S.K., Pelizzola, M., Ricciardi-Castagnoli, P., Florens, L., and Washburn, M.P. (2008). Statistical similarities between transcriptomics and quantitative shotgun proteomics data. Mol. Cell. Proteomics 7, 631-644. Abstract
Polanowska, J., Martin, J.S., Fisher, R., Scopa, T., Rae, I., and Boulton, S.J. (2004). Tandem immunoaffinity purification of protein complexes from Caenorhabditis elegans. Biotechniques 36, 778-780, 782. Abstract
Rao, W., Isaac, R.E., and Keen, J.N. (2011). An analysis of the Caenorhabditis elegans lipid raft proteome using geLC-MS/MS. J. Proteomics 74, 242-253. Abstract Article
Rodriguez, M., Snoek, L.B., De Bono, M., and Kammenga, J.E. (2013). Worms under stress: C. elegans stress response and its relevance to complex human disease and aging. Trends Genet. 29, 367-374. Abstract Article
Schlaitz, A.L., Srayko, M., Dammermann, A., Quintin, S., Wielsch, N., MacLeod, I., de Robillard, Q., Zinke, A., Yates, J.R., 3rd., Muller-Reichert, T., et al. (2007). The C. elegans RSA complex localizes protein phosphatase 2A to centrosomes and regulates mitotic spindle assembly. Cell 128, 115-127. Abstract Article
Simonis, N., Rual, J.F., Carvunis, A.R., Tasan, M., Lemmens, I., Hirozane-Kishikawa, T., Hao, T., Sahalie, J.M., Venkatesan, K., Gebreab, F., et al. (2009). Empirically controlled mapping of the Caenorhabditis elegans protein-protein interactome network. Nat. Methods 6, 47-54. Abstract Article
Skop, A.R., Liu, H., Yates, J., 3rd., Meyer, B.J., and Heald, R. (2004). Dissection of the mammalian midbody proteome reveals conserved cytokinesis mechanisms. Science 305, 61-66. Abstract Article
Smith, L.M., Kelleher, N.L., Linial, M., Goodlett, D., Langridge-Smith, P., Ah Goo, Y., Safford, G., Bonilla, L., Kruppa, G., Zubarev, R., et al. (2013). Proteoform: a single term describing protein complexity. Nat. Methods 10, 186-187. Abstract Article
Sowa, M.E., Bennett, E.J., Gygi, S.P., and Harper, J.W. (2009). Defining the human deubiquitinating enzyme interaction landscape. Cell 138, 389-403. Abstract Article
Tabb, D.L., McDonald, W.H., and Yates, J.R., 3rd. (2002). DTASelect and Contrast: tools for assembling and comparing protein identifications from shotgun proteomics. J. Proteome Res. 1, 21-26. Abstract Article
Talavera, D., Robertson, D.L., and Lovell, S.C. (2013). Alternative splicing and protein interaction data sets. Nat. Biotechnol. 31, 292-293. Abstract Article
Tewari, M., Hu, P.J., Ahn, J.S., Ayivi-Guedehoussou, N., Vidalain, P.O., Li, S., Milstein, S., Armstrong, C.M., Boxem, M., Butler, M.D., et al. (2004). Systematic interactome mapping and genetic perturbation analysis of a C. elegans TGF-β signaling network. Mol. Cell 13, 469-482. Abstract Article
Walhout, A.J.M. and Boulton, S.J. Biochemistry and molecular biology (February 13, 2006), WormBook, ed. The C. elegans Research Community, WormBook, doi/10.1895/wormbook.1.86.1, http://www.wormbook.org.
Washburn, M.P., Wolters, D., and Yates, J.R., 3rd. (2001). Large-scale analysis of the yeast proteome by multidimensional protein identification technology. Nat. Biotechnol. 19, 242-247. Abstract Article
Welburn, J.P., Vleugel, M., Liu, D., Yates, J.R., 3rd., Lampson, M.A., Fukagawa, T., and Cheeseman, I.M. (2010). Aurora B phosphorylates spatially distinct targets to differentially regulate the kinetochore-microtubule interface. Mol. Cell 38, 383-392. Abstract Article
Witte, K., Schuh, A.L., Hegermann, J., Sarkeshik, A., Mayers, J.R., Schwarze, K., Yates, J.R., 3rd., Eimer, S., and Audhya, A. (2011). TFG-1 function in protein secretion and oncogenesis. Nat. Cell Biol. 13, 550-558. Abstract Article
Yates, J.R., Cociorva, D., Liao, L., and Zabrouskov, V. (2006). Performance of a linear ion trap-Orbitrap hybrid for peptide analysis. Anal. Chem. 78, 493-500. Abstract Article
Zanin, E., Dumont, J., Gassmann, R., Cheeseman, I., Maddox, P., Bahmanyar, S., Carvalho, A., Niessen, S., Yates, J.R., 3rd., Oegema, K., et al. (2011). Affinity purification of protein complexes in C. elegans. Methods Cell Biol. 106, 289-322. Abstract Article
Zhang, C., Montgomery, T.A., Fischer, S.E., Garcia, S.M., Riedel, C.G., Fahlgren, N., Sullivan, C.M., Carrington, J.C., and Ruvkun, G. (2012). The Caenorhabditis elegans RDE-10/RDE-11 complex regulates RNAi by promoting secondary siRNA amplification. Curr. Biol. 22, 881-890. Abstract Article
Zhang, L., Ding, L., Cheung, T.H., Dong, M.Q., Chen, J., Sewell, A.K., Liu, X., Yates, J.R., 3rd., and Han, M. (2007). Systematic identification of C. elegans miRISC proteins, miRNAs, and mRNA targets by their interactions with GW182 proteins AIN-1 and AIN-2. Mol. Cell 28, 598-613. Abstract Article
Zhang, P., Na, H., Liu, Z., Zhang, S., Xue, P., Chen, Y., Pu, J., Peng, G., Huang, X., Yang, F., et al. (2012). Proteomic study and marker protein identification of Caenorhabditis elegans lipid droplets. Mol. Cell. Proteomics 11, 317-328. Abstract Article
Zhang, Y., Fonslow, B.R., Shan, B., Baek, M.C., and Yates, J.R., 3rd. (2013). Protein analysis by shotgun/bottom-up proteomics. Chemical Rev. 113, 2343-2394. Abstract Article
*Edited by Oliver Hobert Last revised June 26, 2013, Published June 24, 2014. This chapter should be cited as: Fonslow, B.R., et al. Mass spectrometry-based shotgun proteomic analysis of C. elegans protein complexes (June 24, 2014), WormBook, ed. The C. elegans Research Community, WormBook, doi/10.1895/wormbook.1.171.1, http://www.wormbook.org.
Copyright: © 2014 Bryan R. Fonslow, James J. Moresco, Patricia G. Tu, Antti P. Aalto, Amy E. Pasquinelli, Andrew G. Dillin, and John R. Yates III. This is an open-access article distributed under the terms of the Creative Commons Attribution License, which permits unrestricted use, distribution, and reproduction in any medium, provided the original author and source are credited.
§To whom correspondence should be addressed: E-mail: jmoresco@scripps.edu, jyates@scripps.edu
 All WormBook content, except where otherwise noted, is licensed under a Creative Commons Attribution License.